EUR/USD Forecast: Bears taking over and aiming for another leg south

EUR/USD Current price: 1.1083
- German inflation fell more than anticipated in August, rising by 1.9% YoY.
- The United States upwardly revised the Q2 Gross Domestic Product to 3%.
- EUR/USD at fresh weekly lows and technically poised to extend its slide.
The EUR/USD pair fell to 1.1072 early on Thursday, bouncing just modestly from the level and trading near such a low ahead of the United States (US) opening. The US Dollar gathered momentum during European trading hours, as a sour sentiment dominated the first half of the day.
NVIDIA, the leading AI and chip giant, reported earnings after Wednesday's close, which beat expectations, yet shares fell roughly 8% after the news. Analysts attributed the decline to the fact that revenue guidance for the current quarter missed some estimates, while the company reported that it was facing difficulties in developing a new generation of chips.
Asian indexes closed in the red, but European ones shrugged off the dismal mood and hold in the green, halting the USD advance.
Data-wise, Germany released the preliminary estimates of the August inflation data, which surprised investors by falling more than anticipated. The Consumer Price Index (CPI) rose 1.9% YoY, below the 2.1% anticipated, while the CPI was down 0.1% compared to the previous month. The broader Harmonized Index of Consumer Prices (HICP) increased by 2.0% in the year to August and fell by 0.2% compared to July.
Across the Atlantic, the US published Initial Jobless Claims for the week ended August 23, which decreased to 231K, beating expectations. At the same time, the second estimate of the Q2 Gross Domestic Product (GDP) was upwardly revised to 3% from the previous estimate of 2.8%. The encouraging data provided additional support to the USD.
EUR/USD short-term technical outlook
The daily chart for the EUR/USD pair suggests more slides are on the docket. The pair fell for a second consecutive day, resulting in technical indicators heading firmly south, although still above their midlines. The bearish momentum, however, remains the same. At the same time, the 20 Simple Moving Average (SMA) maintains its bullish slope, providing dynamic support at around 1.1020. A break below the latter should fuel selling.
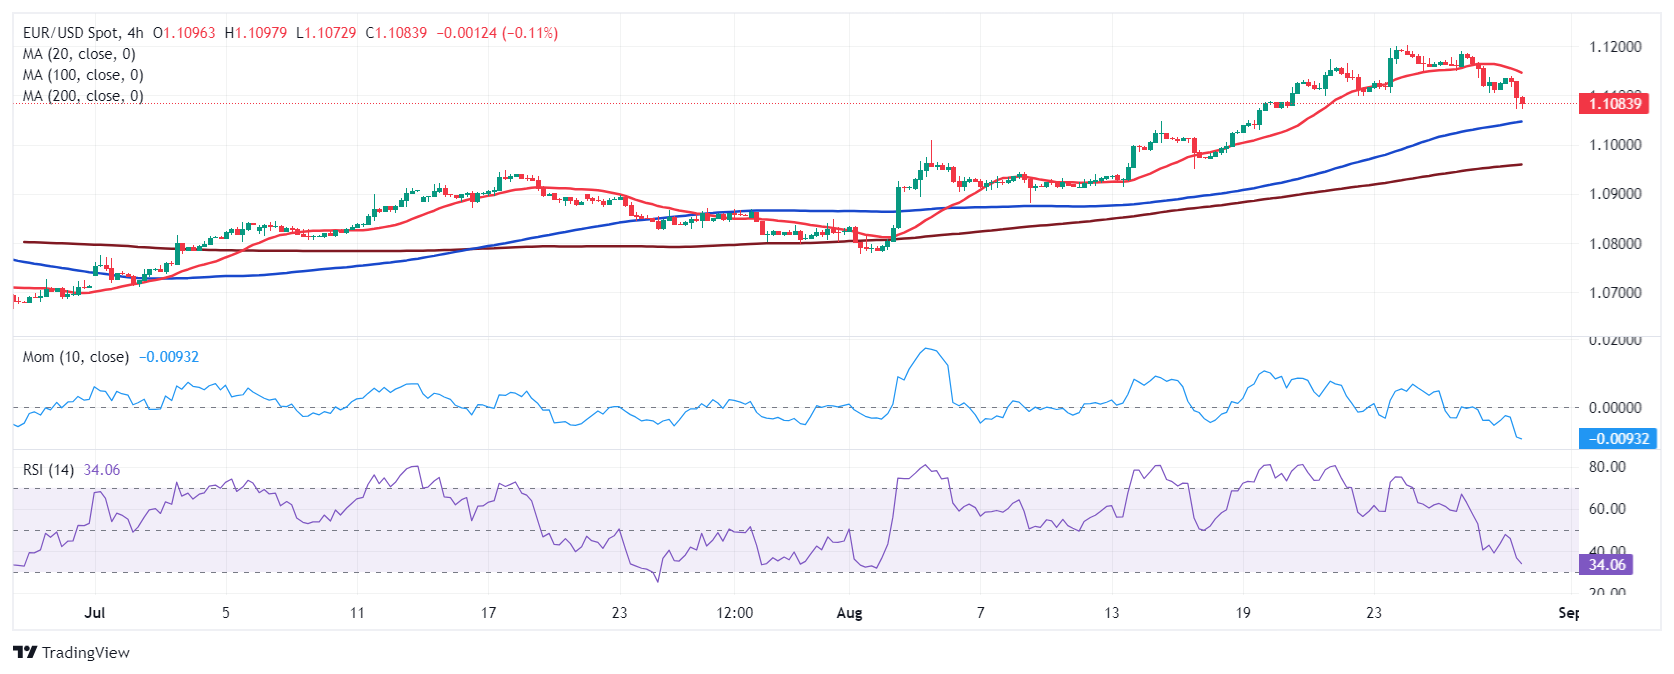
In the near term, and according to the 4-hour chart, the downward momentum eased, but the risk remains skewed to the downside. Technical indicators are stabilizing near oversold readings, still far from suggesting downward exhaustion. Meanwhile, the 20 SMA has turned lower well above the current level, acting as dynamic resistance at around 1.1145.
Support levels: 1.1065 1.1020 1.0985
Resistance levels: 1.1110 1.1145 1.1190
Premium
You have reached your limit of 3 free articles for this month.
Start your subscription and get access to all our original articles.
Author

Valeria Bednarik
FXStreet
Valeria Bednarik was born and lives in Buenos Aires, Argentina. Her passion for math and numbers pushed her into studying economics in her younger years.


