EUR/USD facing an uphill struggle, easier falling than rising – Confluence Detector


The EUR/USD dropped as the US Dollar stormed the board as July came to a close. In the wake of August, the technical picture looks bearish with the path of least resistance being to the downside. 

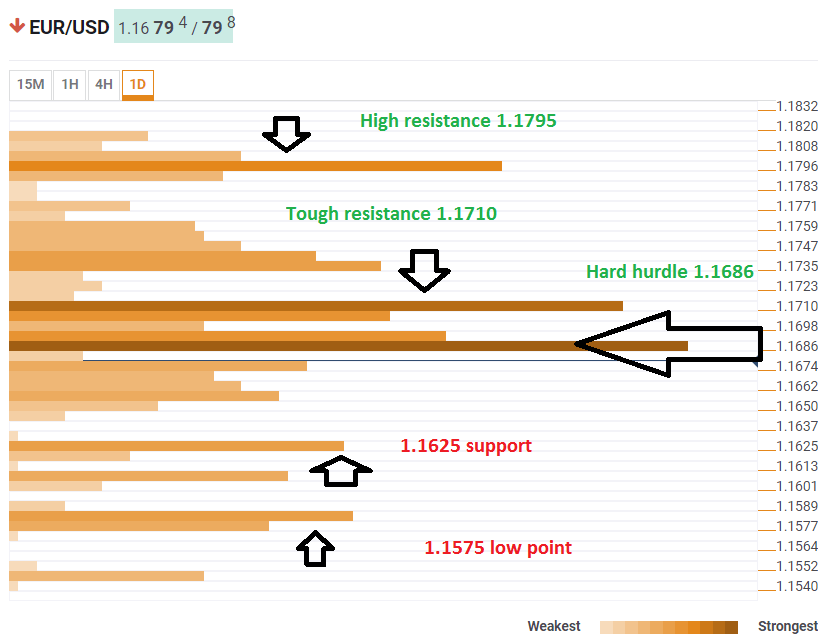
The Technical Confluences Indicator shows that a dense cluster of resistance lines awaits around 1.1686. The area consists of the Bolinger Band 4h-Middle, the BB 15m-Middle, the 1h-high, one-day low, the Simple Moving Average 5-1h, the SMA 100-4h, the SMA 5-one-day, and a few others in the immediate vicinity.

Another significant hurdle awaits the pair close by. At 1.1710 we see the convergence of the Simple Moving Average 10-4h, the Fibonacci 38.2% one-day, the Fibonacci 38.2% one-month, the SMA 200-15m, the SMA 50-1h, the BB 1h-Middle, the Fibonacci 61.8% one-week, and the SMA 100-15m.

If the EUR/USD has enough momentum to break higher, the path is full of resistance lines to the upside, with the most notable confluence awaiting at 1.1795 which is last month's high, the Pivot Point one-day Resistance 3, and the Fibonacci 161.8% one-day.

Looking down, there are no confluence lines of the same magnitude. 1.1625 is the meeting point of the last week's low, the BB one-day-Lower, and the BB 4h-Lower. 

Further down, 1.1575 is last month's low and the Pivot Point one-month Support 1.

Here is how it looks on the tool:

EUR USD technical analysis August 1 2018

Confluence Detector

The Confluence Detector finds exciting opportunities using Technical Confluences. The TC is a tool to locate and point out those price levels where there is a congestion of indicators, moving averages, Fibonacci levels, Pivot Points, etc. Knowing where these congestion points are located is very useful for the trader, and can be used as a basis for different strategies.

This tool assigns a certain amount of “weight” to each indicator, and this “weight” can influence adjacents price levels. These weightings mean that one price level without any indicator or moving average but under the influence of two “strongly weighted” levels accumulate more resistance than their neighbors. In these cases, the tool signals resistance in apparently empty areas.

Learn more about Technical Confluence

Information on these pages contains forward-looking statements that involve risks and uncertainties. Markets and instruments profiled on this page are for informational purposes only and should not in any way come across as a recommendation to buy or sell in these assets. You should do your own thorough research before making any investment decisions. FXStreet does not in any way guarantee that this information is free from mistakes, errors, or material misstatements. It also does not guarantee that this information is of a timely nature. Investing in Open Markets involves a great deal of risk, including the loss of all or a portion of your investment, as well as emotional distress. All risks, losses and costs associated with investing, including total loss of principal, are your responsibility. The views and opinions expressed in this article are those of the authors and do not necessarily reflect the official policy or position of FXStreet nor its advertisers. The author will not be held responsible for information that is found at the end of links posted on this page.

If not otherwise explicitly mentioned in the body of the article, at the time of writing, the author has no position in any stock mentioned in this article and no business relationship with any company mentioned. The author has not received compensation for writing this article, other than from FXStreet.

FXStreet and the author do not provide personalized recommendations. The author makes no representations as to the accuracy, completeness, or suitability of this information. FXStreet and the author will not be liable for any errors, omissions or any losses, injuries or damages arising from this information and its display or use. Errors and omissions excepted.

The author and FXStreet are not registered investment advisors and nothing in this article is intended to be investment advice.

Recommended Content


Recommended Content

Editors’ Picks

AUD/USD extends its upside above 0.6600, eyes on RBA rate decision

AUD/USD extends its upside above 0.6600, eyes on RBA rate decision

The AUD/USD pair extends its upside around 0.6610 during the Asian session on Monday. The downbeat US employment data for April has exerted some selling pressure on the US Dollar across the board. Investors will closely monitor the Reserve Bank of Australia interest rate decision on Tuesday.

AUD/USD News

EUR/USD: Optimism prevailed, hurting US Dollar demand

EUR/USD: Optimism prevailed, hurting US Dollar demand

The EUR/USD pair advanced for a third consecutive week, accumulating a measly 160 pips in that period. The pair trades around 1.0760 ahead of the close after tumultuous headlines failed to trigger a clear directional path.

EUR/USD News

Gold holds below $2,300, Fedspeak eyed

Gold holds below $2,300, Fedspeak eyed

Gold price loses its recovery momentum around $2,295 on Monday during the early Asian session. Investors will keep an eye on Fedspeaks this week, along with the first reading of the US Michigan Consumer Sentiment Index for May on Friday.

Gold News

Bitcoin Cash could become a Cardano partnerchain as 66% of 11.3K voters say “Aye”

Bitcoin Cash could become a Cardano partnerchain as 66% of 11.3K voters say “Aye”

Bitcoin Cash is the current mania in the Cardano ecosystem following a proposal by the network’s executive inviting the public to vote on X, about a possible integration.

Read more

Week ahead: BoE and RBA decisions headline a calm week

Week ahead: BoE and RBA decisions headline a calm week

Bank of England meets on Thursday, unlikely to signal rate cuts. Reserve Bank of Australia could maintain a higher-for-longer stance. Elsewhere, Bank of Japan releases summary of opinions.

Read more

Majors

Cryptocurrencies

Signatures