EUR/USD Elliott Wave technical analysis [Video]
![EUR/USD Elliott Wave technical analysis [Video]](https://editorial.fxstreet.com/images/Markets/Currencies/Majors/EURUSD/money-59004818_XtraLarge.jpg)
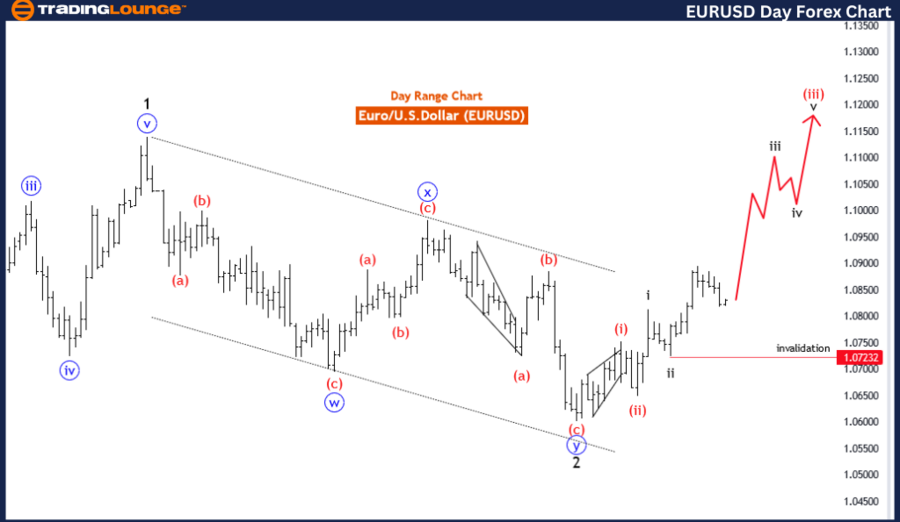
EURUSD Elliott Wave Analysis Trading Lounge Day Chart,
Euro/U.S.Dollar(EURUSD) Day Chart.
EUR/USD Elliott Wave technical analysis
Function: Trend.
Mode: Impulsive.
Structure: Black Wave 3.
Position: Red Wave 3.
Direction next lower degrees: Black Wave 4.
Details: Black wave 2 of red wave 3 looking completed at 1.07232, now black wave 3 of 3 is in play.
Wave Cancel invalid level:1.07232
The EURUSD Elliott Wave analysis on the daily chart provides a detailed view of the current market trend and its expected movements according to the Elliott Wave theory. The primary function of this analysis is to identify the ongoing trend, which is classified as impulsive. This indicates that the market is experiencing strong directional movements, characterized by significant price shifts that align with the main trend direction.
The central structure under analysis is black wave 3, a critical component of the impulsive wave cycle. Within this broader wave structure, the market is positioned in red wave 3, signifying an ongoing and typically powerful phase of market activity. Red wave 3 is often marked by substantial price movements and is a pivotal part of the impulsive wave sequence.
Looking ahead, the analysis points towards black wave 4 as the next direction for the lower degrees. This wave will follow the completion of black wave 3 and generally involves a corrective phase where the market consolidates its recent price changes before resuming the primary trend.
The details of the analysis highlight that black wave 2 of red wave 3 appears to be completed at a specific price level. This completion indicates that the market is now in the phase of black wave 3 of 3, suggesting continued strong market activity as part of the larger impulsive wave structure.
A critical aspect of this analysis is the wave cancel invalid level, set at a particular price point. If the market price falls below this level, it would invalidate the current wave count, necessitating a reassessment of the Elliott Wave structure. This invalidation level is crucial for confirming the accuracy of the wave pattern and the anticipated market direction.
In summary, the EURUSD pair is currently in an impulsive trend on the daily chart, situated within the third wave of the black wave 3 sequence. The market has completed black wave 2 and is now progressing through black wave 3 of 3. Monitoring the invalidation level is essential to validate the current wave count and accurately forecast future market movements.
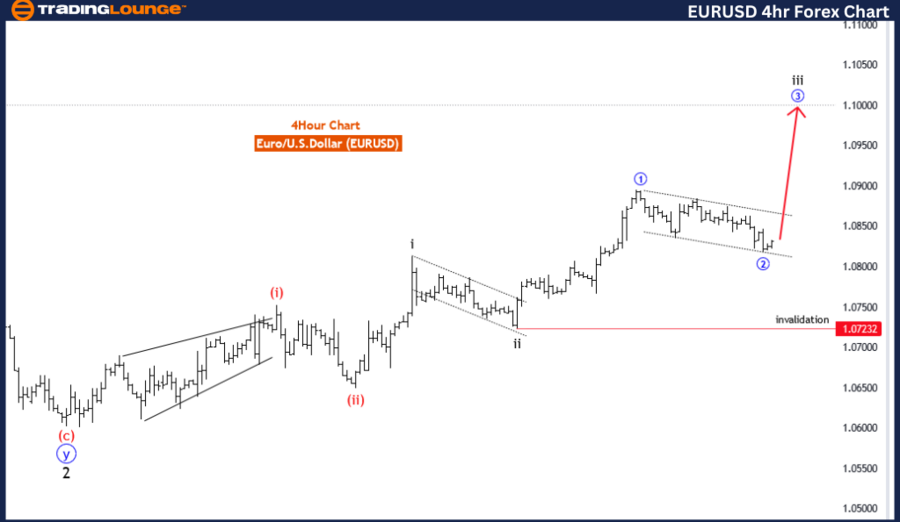
EURUSD Elliott Wave Analysis Trading Lounge 4 Hour Chart,
Euro/U.S.Dollar(EURUSD) 4 Hour Chart.
EUR/USD Elliott Wave technical analysis
Function: Trend.
Mode: Impulsive.
Structure: Blue Wave 3.
Position: Black Wave 3.
Direction next lower degrees: Blue wave 4.
Details: Blue wave 2 of black wave 3 looking completed, now blue wave 3 of 3 is in play.
Wave Cancel invalid level: 1.07232.
The EURUSD Elliott Wave analysis on the 4-hour chart offers an insightful perspective on the current market trend and its anticipated movements within the Elliott Wave framework. The primary function of this analysis is to identify and understand the trend direction, which is currently classified as impulsive. This suggests strong, directional movements in the market, characterized by decisive price actions that align with the main trend.
The main structure under consideration is blue wave 3, an integral part of the impulsive wave cycle. Within this broader structure, the position is identified as black wave 3. This placement indicates that the market is experiencing the third wave of the blue wave 3 sequence, which is typically one of the most powerful and extensive waves in the Elliott Wave theory, often marked by significant price increases or decreases.
Looking forward, the direction for the next lower degrees points towards blue wave 4. This wave will follow the completion of blue wave 3, and it typically involves a corrective phase where the market consolidates its recent gains or losses before continuing in the direction of the main trend.
The analysis details that blue wave 2 of black wave 3 appears to be completed. This completion sets the stage for blue wave 3 of 3 to be in play, indicating a robust and extended market movement as part of the larger impulsive wave structure.
A critical aspect of this analysis is the wave cancel invalid level, set at a specific price point. If the market price falls below this level, it would invalidate the current wave count, requiring a reassessment of the Elliott Wave structure. This invalidation level serves as a vital checkpoint for confirming the accuracy of the wave pattern and the expected market direction.
Dy
In summary, the EURUSD pair is currently in an impulsive trend on the 4-hour chart, within the third wave of the blue wave 3 sequence. The market has completed blue wave 2 and is now progressing through blue wave 3 of 3. Monitoring the invalidation level is crucial to validate the current wave count and forecast future market movements accurately.
Technical analyst: Malik Awais.
EUR/USD Elliott Wave technical analysis [Video]
Author

Peter Mathers
TradingLounge
Peter Mathers started actively trading in 1982. He began his career at Hoei and Shoin, a Japanese futures trading company.


