EUR/USD Analysis: bears will wait for the Fed to add pressure

EUR/USD Current Price: 1.1125
- US Q2 GDP at 2.1% according to preliminary estimates, hinted a soft Fed’s stance.
- US growth backed by consumer’s and government’s spending, business investment lags.
- EUR/USD trading just above yearly lows, heading toward the 1.1000 psychological barrier.
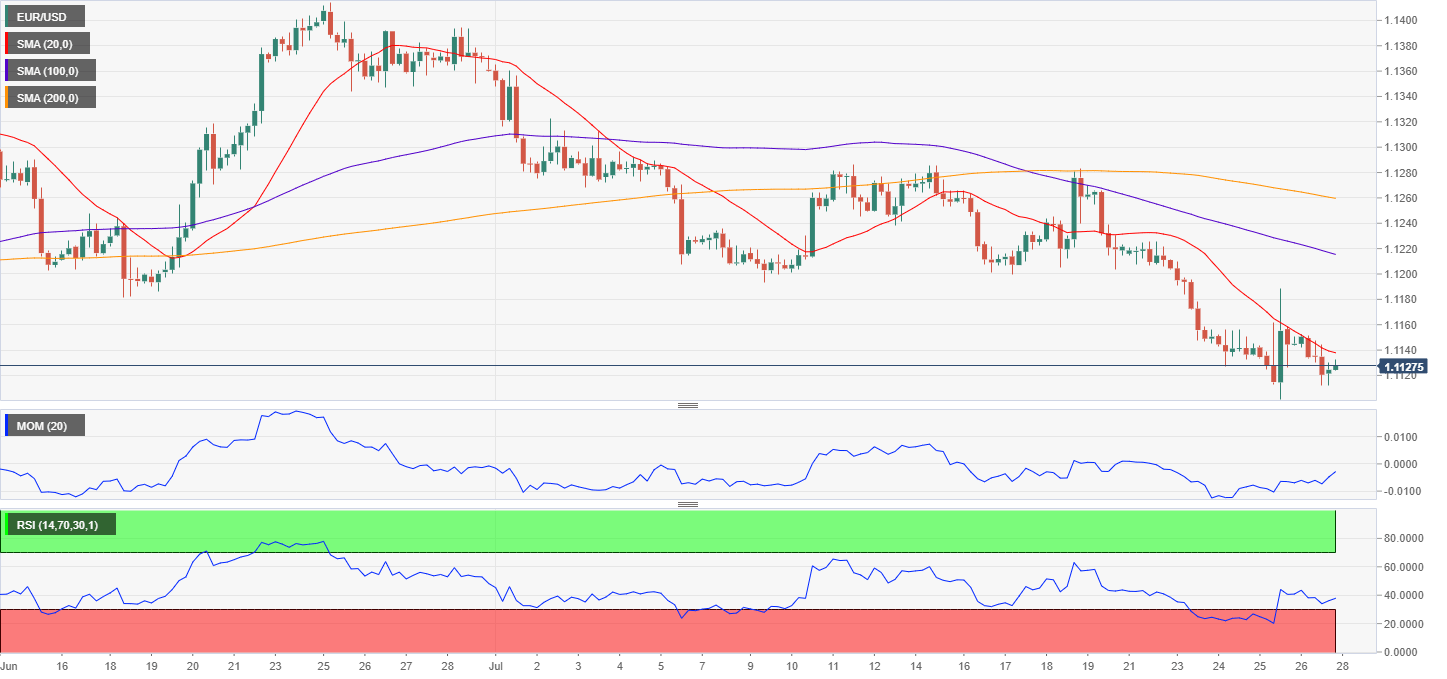
After reaching a fresh two-year low, the EUR/USD pair has finished the week not far above such low at 1.1125, as the dollar got an additional impulse at the end of the week from a better-than-expected Q2 GDP reading. According to the preliminary estimate, the US economy has grown by 2.1% in the three months to June, beating the market’s forecast of 1.8%, although below the previous quarter 3.1%. Consumer´s and government´s spending propelled growth, although business investment decreased by 5.5%. Nevertheless, the report was enough to back speculation that the US Federal Reserve would probably cut rates by just 25bps this week, without hinting a soon-to-come additional cut. PCE inflation in the same quarter rose by 2.3%, while the core reading hit 1.8%, better than the previous 1.1% but below the 2.0% expected.
The upcoming week will start in slow motion, at least from the macroeconomic side, as there are no relevant data scheduled in the European Union, while the US will release just the Dallas Fed Manufacturing Business Index for July. The market could choose to move into wait-and-see mode ahead of the US Federal Reserve announcement next Wednesday.
EUR/USD short-term technical outlook
The EUR/USD pair bottomed at 1.1101 with a subsequent recovery stalling around 1.1187. At 1.1175, the pair has the 23.6% retracement of the 1.1411/1.1101 decline, which makes of the 1.1170/80 price zone the first barrier to the upside. The 1.1100 figure, on the other hand, is the immediate support with a break below the level favoring a continued decline toward the 1.1020/40 price zone. In the daily chart, the 20 DMA crossed below the 100 DMA, both over 100 pips above the current level, while the Momentum indicator remains within negative levels, stable after correcting oversold readings, and as the RSI indicator continues heading south, currently at 35. Shorter term, and according to the 4 hours chart, the risk is also skewed to the downside, as a bearish 20 SMA steadily rejected attempts to rise, while the RSI hovers around 36. The fact that the pair didn’t break below its previous low kept the Momentum directionless just below its 100 level.
Support levels: 1.1100 1.1070 1.1030
Resistance levels: 1.1145 1.1180 1.1215
Author

Valeria Bednarik
FXStreet
Valeria Bednarik was born and lives in Buenos Aires, Argentina. Her passion for math and numbers pushed her into studying economics in her younger years.