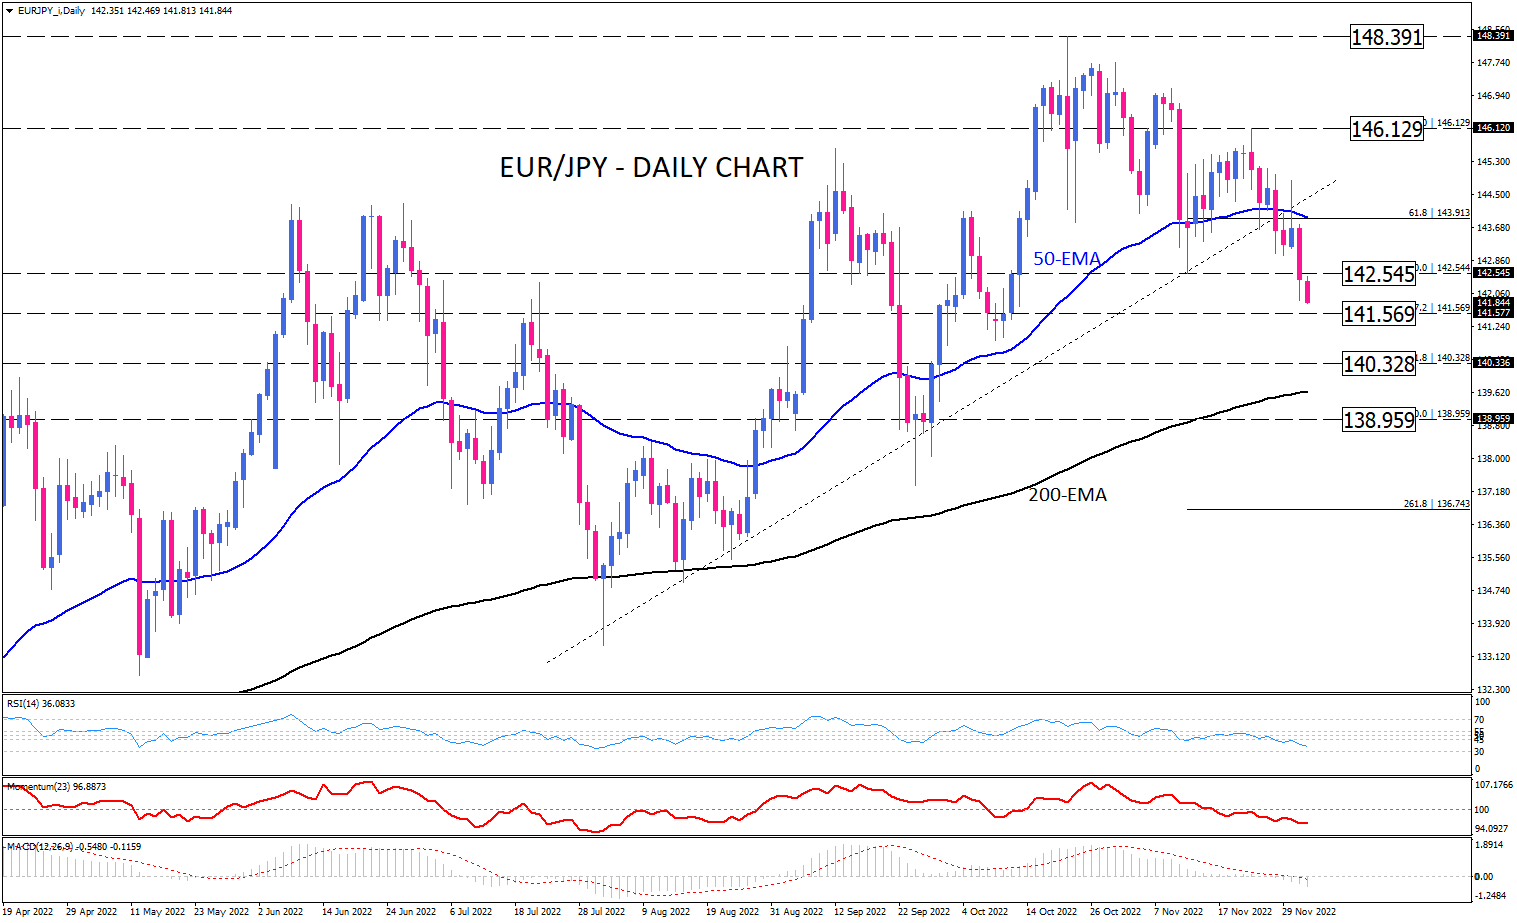
EUR/JPY has been suffering from prevailing selling pressure in recent weeks. As soon as sellers spotted the end of the uptrend that started in March, they also pushed the price below the 50-EMA on the daily chart. A decisive break below the 142.545 hurdle convinced many traders that the bearish sentiment would last longer. This resulted in the formation of a head and shoulders pattern bolstering euro sellers' odds. The neckline can be drawn by connecting the lows on September 23 and November 11. Thus, as long as they manage to keep the price below this key level the setup is considered bearish.
Meantime, if selling forces keep strengthening the next target would emerge at 141.569. A further decline below this barricade could bring 140.328 into bears’ sight. If that happens, the first H&S projection will be captured at the half distance between the head and the neckline.
Otherwise, euro buyers are unlikely to be able to turn back into the game until the price has recouped all these two days' losses by getting back over the 142.454 level of interest. However, even in such a case, only a breach of the right shoulder at 146.129 will invalidate the H&S pattern.
Short-term momentum oscillators imply a bearish picture. RSI is trending downward in the selling area, heading towards the oversold boundary at 30. Momentum, also, is dipping in the selling zone, below the 100-threshold. At the same time, both MACD bars and the signal line have crossed the zero line to the downside, triggering a bearish signal.
The content of this material and/or any information provided should in no way be construed, expressly or by implication, directly or indirectly, as advice, recommendation, or suggestion of an investment strategy in relation to a financial instrument and is not intended to provide a sufficient basis for making investment decisions in any way. Any information, views or opinions presented in this material have been obtained or derived from sources believed to be reliable, but Errante makes no warranty as to their accuracy or completeness. Errante accepts no liability for losses arising from the use of this data and information. The data and information contained herein are for background purposes only and make no claim to be complete or comprehensive.
Recommended Content
Editors’ Picks
EUR/USD holds above 1.0700 ahead of key US data

EUR/USD trades in a tight range above 1.0700 in the early European session on Friday. The US Dollar struggles to gather strength ahead of key PCE Price Index data, the Fed's preferred gauge of inflation, and helps the pair hold its ground.
USD/JPY stays above 156.00 after BoJ Governor Ueda's comments

USD/JPY holds above 156.00 after surging above this level with the initial reaction to the Bank of Japan's decision to leave the policy settings unchanged. BoJ Governor said weak Yen was not impacting prices but added that they will watch FX developments closely.
Gold price oscillates in a range as the focus remains glued to the US PCE Price Index

Gold price struggles to attract any meaningful buyers amid the emergence of fresh USD buying. Bets that the Fed will keep rates higher for longer amid sticky inflation help revive the USD demand.
Sei Price Prediction: SEI is in the zone of interest after a 10% leap

Sei price has been in recovery mode for almost ten days now, following a fall of almost 65% beginning in mid-March. While the SEI bulls continue to show strength, the uptrend could prove premature as massive bearish sentiment hovers above the altcoin’s price.
US core PCE inflation set to signal firm price pressures as markets delay Federal Reserve rate cut bets

The core PCE Price Index, which excludes volatile food and energy prices, is seen as the more influential measure of inflation in terms of Fed positioning. The index is forecast to rise 0.3% on a monthly basis in March, matching February’s increase.