EUR/JPY buying the dips at the blue box

We’re going to take a quick look at the Elliott Wave charts of EURJPY pair, published in the members area of the website. EURJPY is showing bullish sequences in the cycle from the 05/07 (114.474 ) low. As our members know, we’ve been calling rally in this forex pair. We recommended members to avoid selling in any proposed pull back and keep buying the dips in 3,7,11 swings. Recently EURJPY made a pullback that has unfolded as Elliott Wave Zig Zag pattern. In the further text we are going to explain the Elliott Wave Pattern Forecast and Trading Strategy.
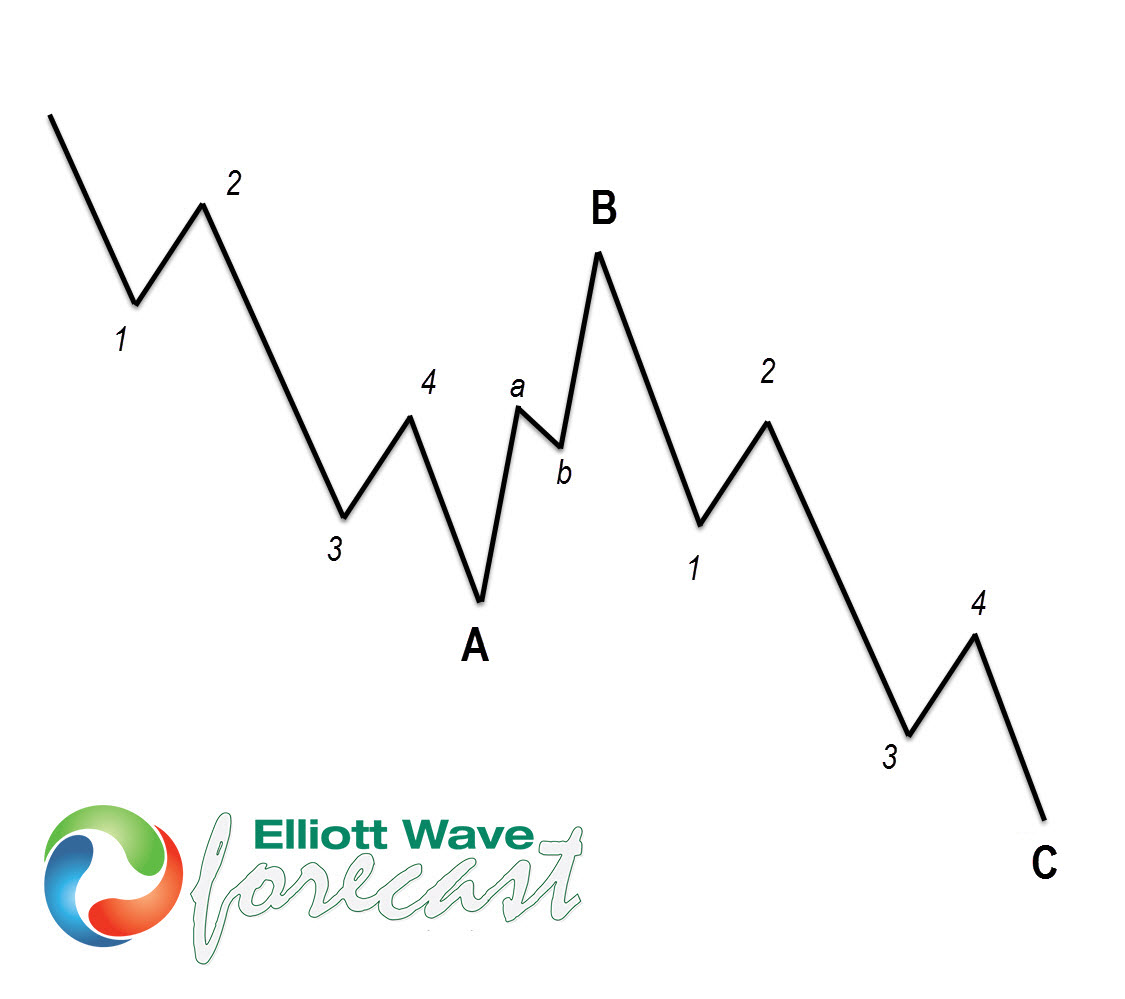
Before we take a look at the real market example, let’s explain Elliott Wave Zigzag.
Elliott Wave Zigzag is the most popular corrective pattern in Elliott Wave theory. It’s made of 3 swings which have 5-3-5 inner structure. Inner swings are labeled as A, B,C where A =5 waves, B=3 waves and C=5 waves. That means A and C can be either impulsive waves or diagonals. (Leading Diagonal in case of wave A or Ending in case of wave C) . Waves A and C must meet all conditions of being 5 wave structure, such as: having RSI divergency between wave subdivisions, ideal Fibonacci extensions, and ideal retracements.
Now let’s take a look what Elliott Wave Zig Zag looks like in real market example and how we traded it.
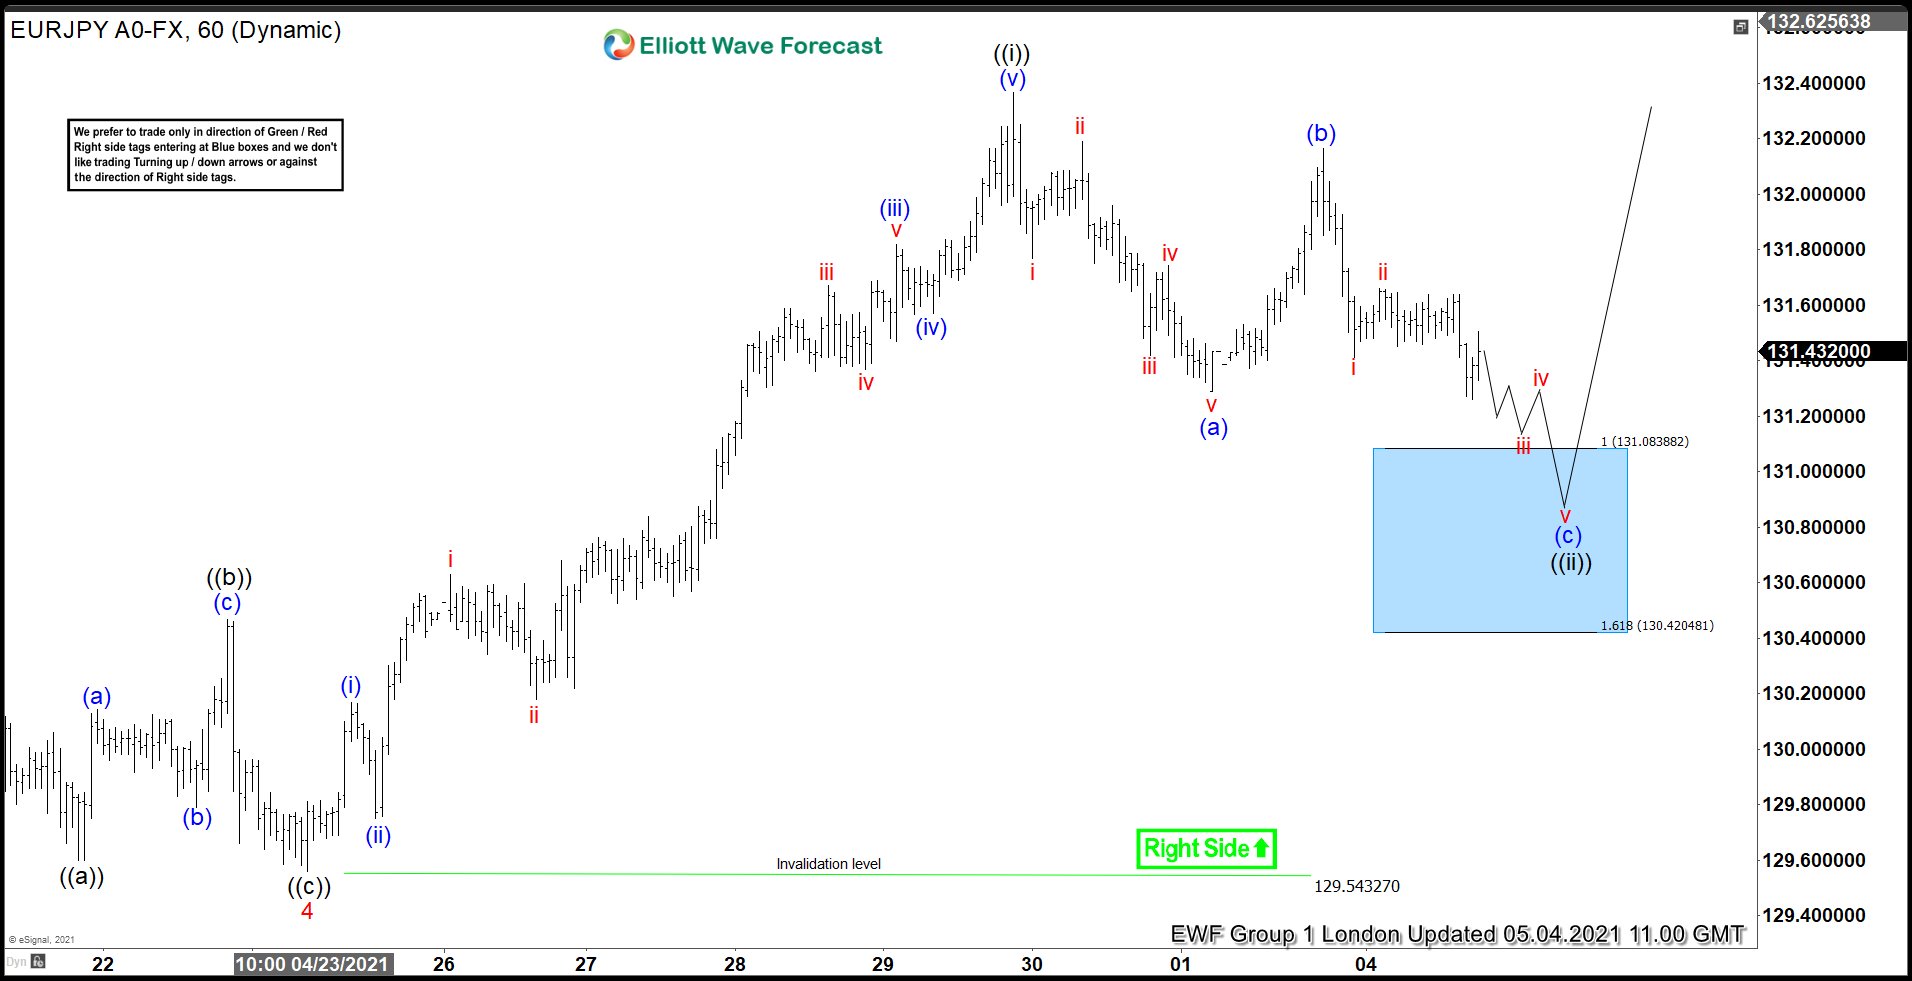
EUR/JPY Elliott Wave 1 Hour chart 5.4.2021
Right side remains in the favor of the Forex pair. EURJPY remains buy in a dips. Wave (ii) black pullback is unfolding as Elliott Wave Zig Zag pattern with inner labeling: (a)(b)(c) blue. We can see that wave (a) blue shows clear 5 waves structures. At the moment pullback looks incomplete. The price is missing equal legs from the peak, and wave (c) blue leg doesn’t have 5 waves yet. The pair should ideally see more short term weakness toward blue box area: 131.083-130.42 . We don’t recommend selling and favor the long side from the mentioned zone. As the main trend is bullish we expect buyers to appear for 3 waves bounce at least. Trading strategy is waiting for Equal legs: Blue Box to be reached before buying the pair.
As our members know, Blue Boxes are no enemy areas, giving us 85% chance to get a bounce.
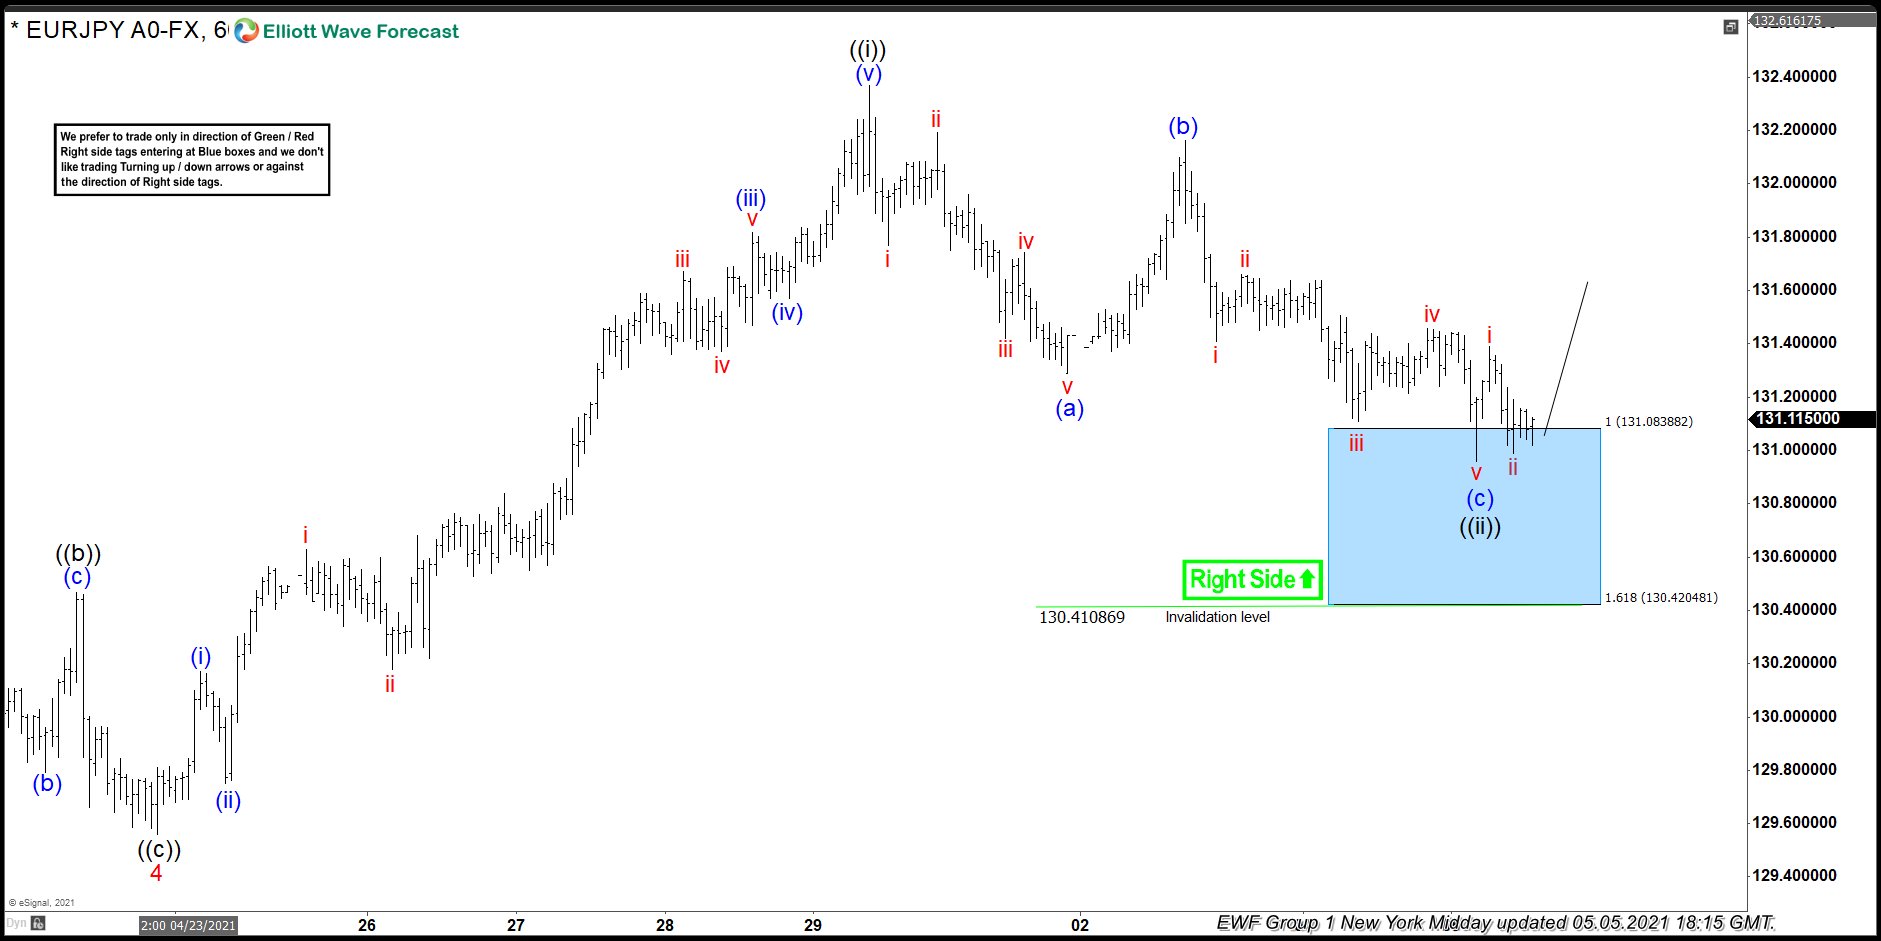
EUR/JPY Elliott Wave 1 Hour chart 5.5.2021
The pair made more downside toward the blue box as expected. The price made 5 waves down in (c) leg. Buyers appeared and we are getting reaction. We believe pull back is completed at 130.95 low, however bounce is still shallow. We still need to see further separation from the latest low to confirm cycle from the peak is completed. As soon as the price reaches 50 fibs against the (b) high we will make long positions risk free. ( put SL at BE). If the price breaks current short term low, we will stick with the long trade as far as the price stays above 1.618 fib ext level: 130.42.
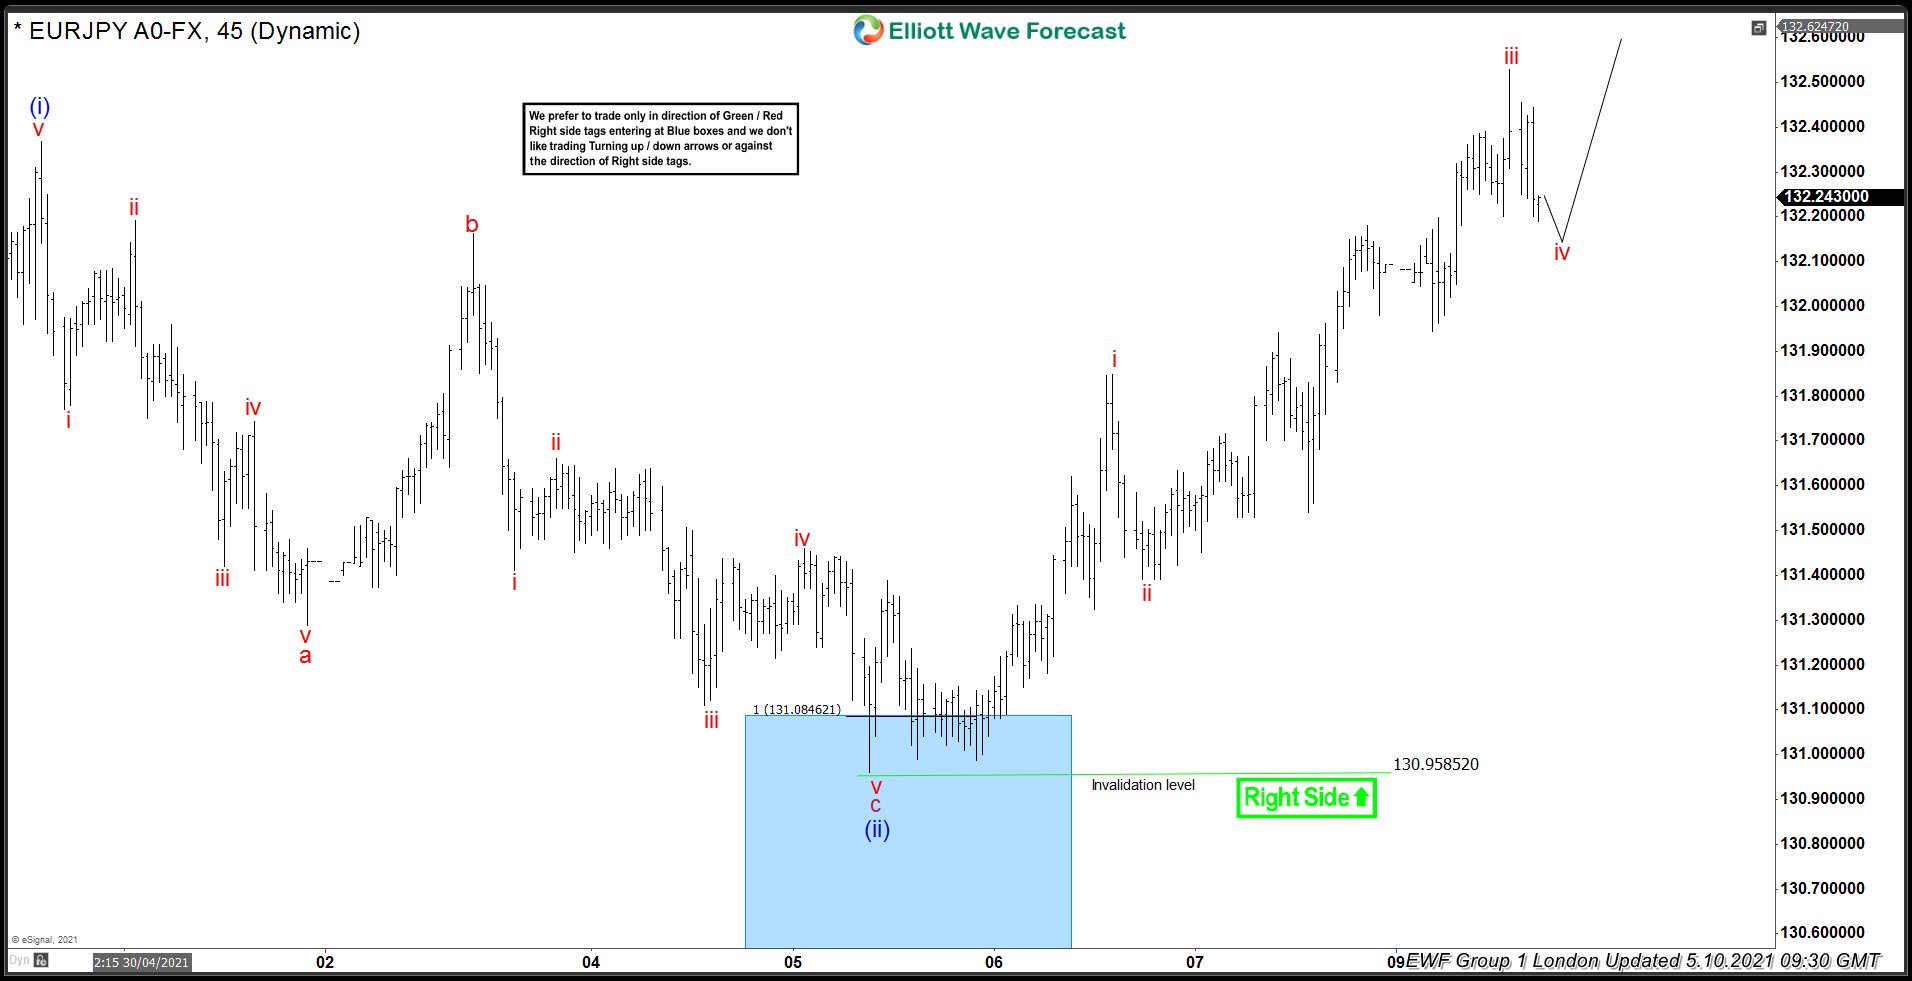
EUR/JPY Elliott Wave 1 Hour chart 5.5.2021
130.95 low held nicely and the Forex Pair made further rally. Eventually, the price has broken previous peak 04/29, confirming next leg up is in progress. Right side remains the long side. We don’t recommend selling the pair in any proposed pull back and favor the long side. The pair is expected to keep finding buyers in 3,7,11 swings.
Author

Elliott Wave Forecast Team
ElliottWave-Forecast.com


