Dollar index testing support, EUR/USD fades resistance.

EUR/USD:
Weekly timeframe:
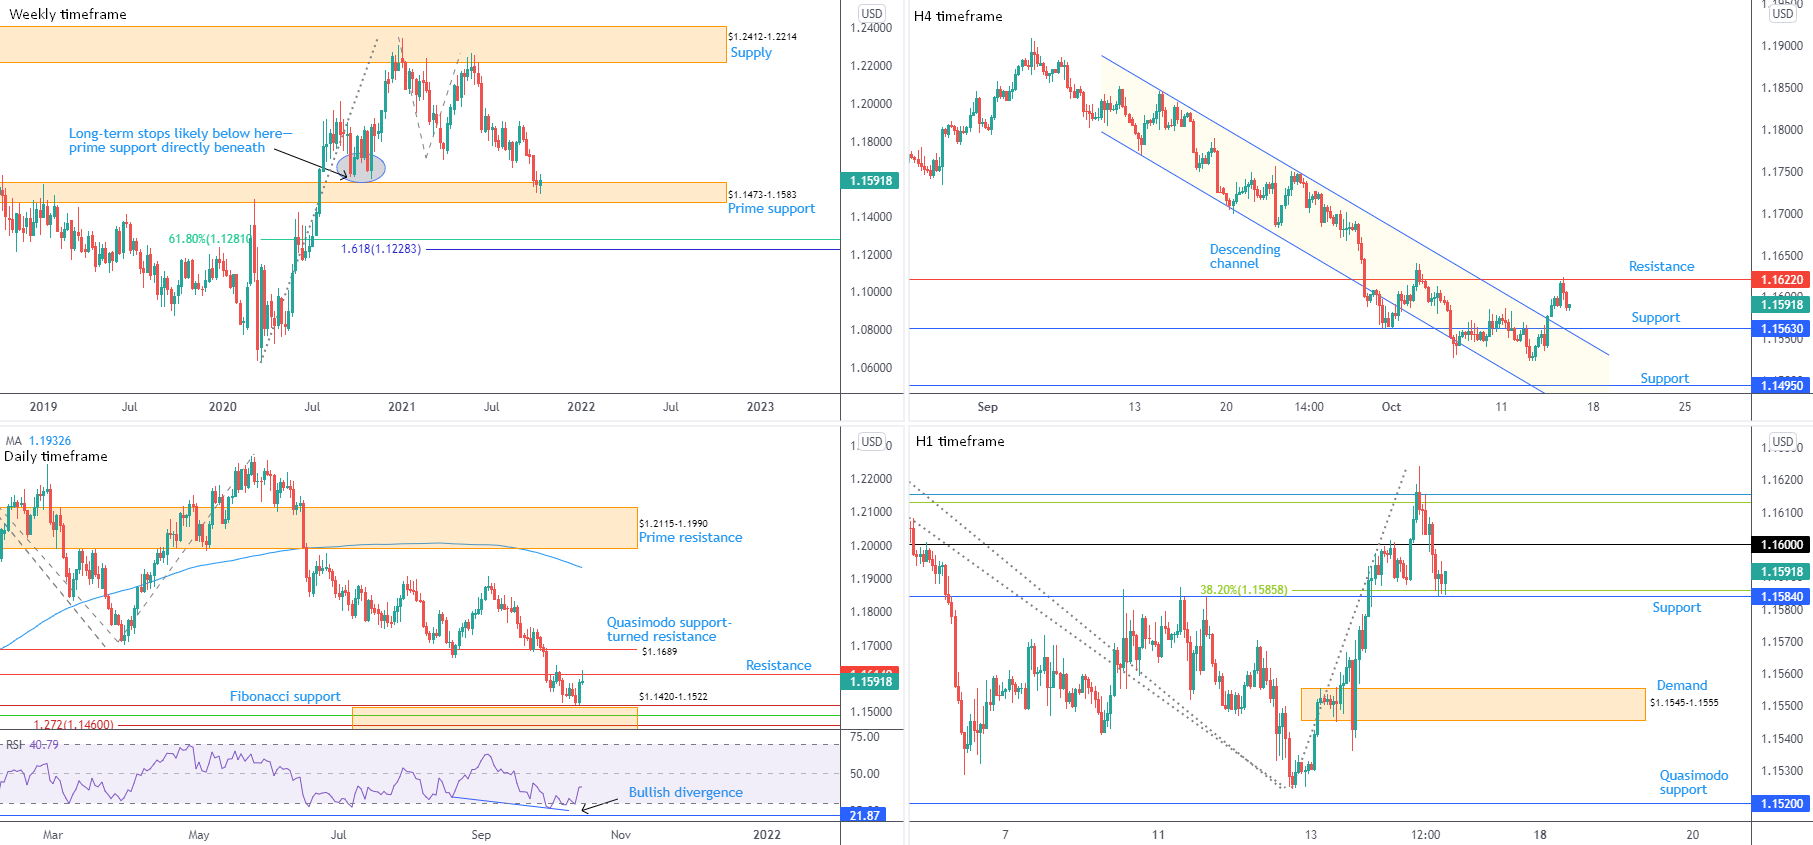
Buyers and sellers continue to battle for position around the upper region of prime support at $1.1473-1.1583. Buyers making a stand remains on the table, potentially fuelled on the back of long-term sell-stops tripped beneath lows at $1.1612 (2020).
In the event buyers fail to agree higher prices, south of current support shines the technical spotlight on a 61.8% Fibonacci retracement at $1.1281, organised above a 1.618% Fibonacci projection from $1.1228.
Daily timeframe:
Hindering upside on the weekly scale is the daily timeframe’s resistance from $1.1614, a level serving this market since October 2018. Candlestick enthusiasts will note Thursday’s test established a shooting star pattern (bearish signal), suggesting Fibonacci support between $1.1420 and $1.1522 is perhaps the next port of call—glued to the lower side of the weekly timeframe’s prime support.
Out of the relative strength index (RSI), the value recently pulled in hidden divergence from within oversold territory. The 50.00 centreline is now a watched level; movement north of the latter signals positive momentum.
H4 timeframe:
Resistance at $1.1622, fixed a few pips above daily resistance at $1.1614, put in an appearance on Thursday. Subsequent downside fashioned two back-to-back bearish candles, outlining a potential test of support from $1.1563, which happens to share chart space with channel resistance-turned support, extended from the high $1.1846.
Medium-term sentiment facing southbound since June, as suggested in previous writing, likely increased the appeal of current resistance.
H1 timeframe:
A combination of a 38.2% Fibonacci retracement at $1.1613 (green) and a 78.6% Fibonacci retracement at $1.1615 (blue) established resistance north of $1.16 yesterday.
US hours settled around support at $1.1584 (aided by a 38.2% Fibonacci retracement at $1.1586) with a break implying a short-term bearish vibe in the direction of demand at $1.1545-1.1555 (plotted just beneath H4 support at $1.1563).
Observed Technical Levels:
Daily and H4 timeframes trading from resistance at $1.1614 and $1.1622, respectively, places a question mark on H1 support at $1.1584. With this being the case, a H1 close beneath the latter reflects a bearish climate to H4 support at $1.1563 and H1 demand at $1.1545-1.1555. A retest forming at the underside of $1.1584 will likely be viewed as additional price confirmation.
AUD/USD:
Weekly timeframe:
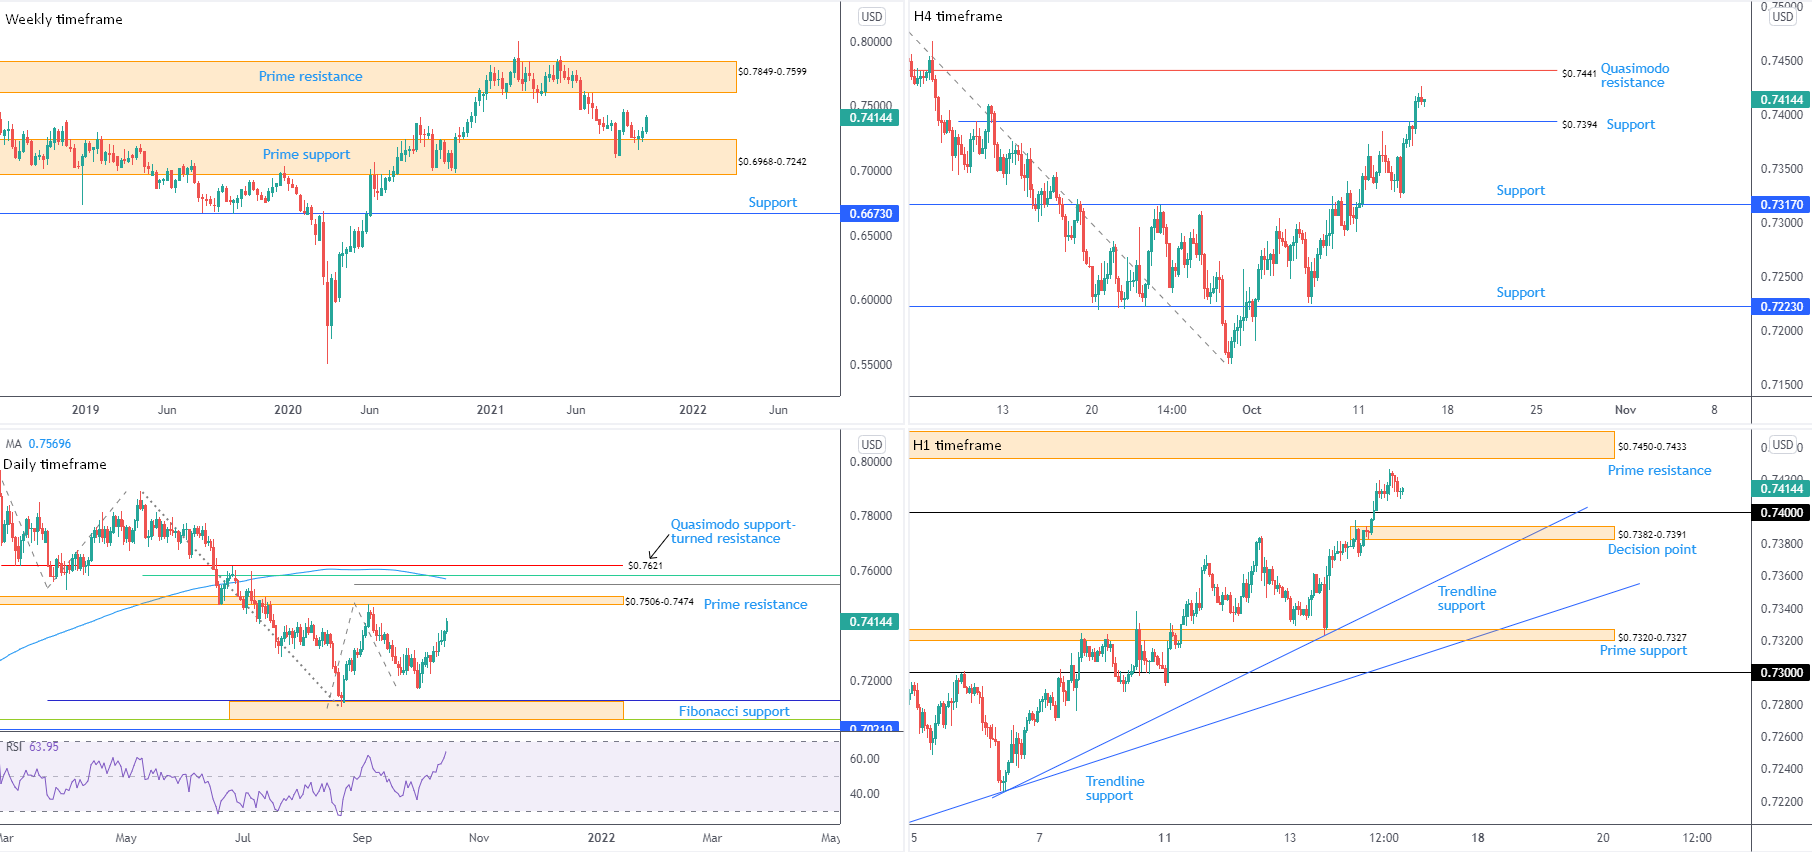
Buyers, once again, emerged from prime support at $0.6968-0.7242. Prime resistance at $0.7849-0.7599 is a reasonable target, though failure to preserve gains opens up support at $0.6673.
Trend studies on the weekly scale show we’ve been higher since early 2020. Consequently, the response from $0.6968-0.7242 might be the start of a dip-buying attempt to join the current trend.
Daily timeframe:
Upbeat market sentiment boosted demand for the Australian dollar versus the US dollar on Thursday, refreshing monthly tops at $0.7427 and closing in on prime resistance at $0.7506-0.7474. Immediately above here, Quasimodo support-turned resistance is at $0.7621, joined closely with the 200-day simple moving average at $0.7570, a 61.8% Fibonacci retracement at $0.7585 and a 100% Fibonacci projection at $0.7551.
Latest out of the relative strength index (RSI) reveals the value zeroing in on overbought territory, currently hovering around 64.00ish.
H4 timeframe:
Quasimodo resistance at $0.7394 was brushed aside Thursday, leaving behind possible support and throwing light on Quasimodo resistance at $0.7441.
H1 timeframe:
The break of $0.74 potentially clears the river north to prime resistance at $0.7450-0.7433. However, traders are urged to note the possibility of price retesting $0.74, action that could open the door to a whipsaw into a decision point from $0.7382-0.7391.
Observed Technical Levels:
Scope to discover higher levels on the bigger picture until reaching resistance at $0.7506-0.7474 on the daily timeframe highlights support around $0.74 on the H1 timeframe. Between the H1 decision point at $0.7382-0.7391 and $0.74 (an area including H4 support from $0.7394), therefore, might welcome a bullish phase if tested.
USD/JPY:
Weekly timeframe:
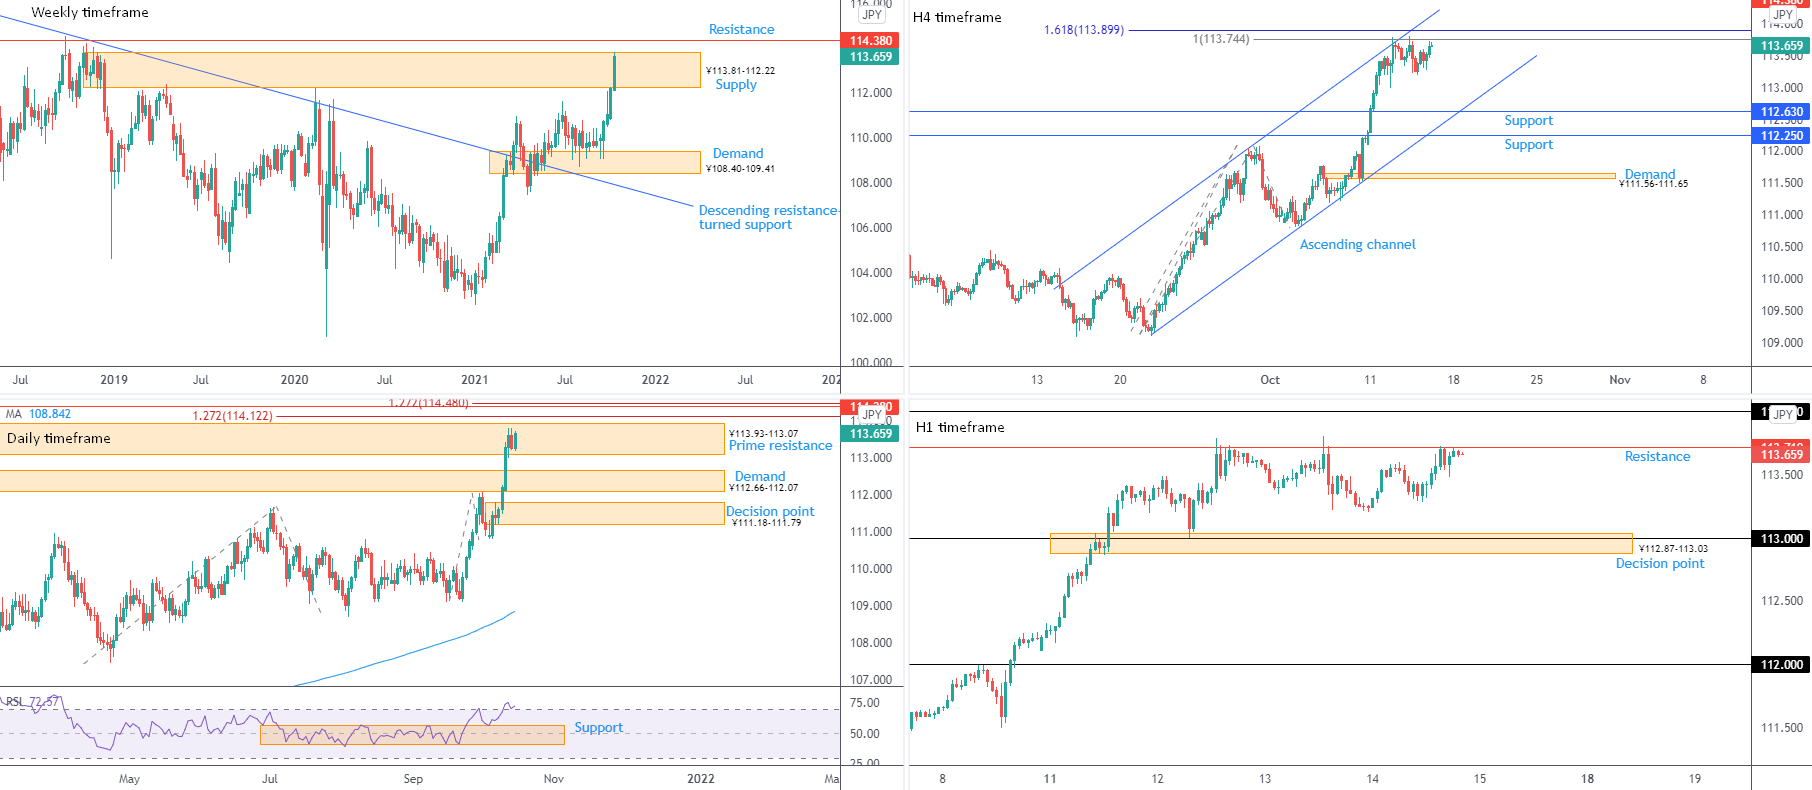
Supply at ¥113.81-112.22 remains under considerable pressure, with neighbouring resistance arranged at ¥114.38.
Sellers taking the wheel directs flow to familiar demand at ¥108.40-109.41—arranged north of descending resistance-turned support, taken from the high ¥118.61.
In terms of the immediate trend, we’ve been advancing since the beginning of this year.
Daily timeframe:
Thursday’s bout of risk-on trade weighed on demand for the Japanese yen, consequently elevating USD/JPY to around the recent 34-month top at ¥113.81.
Prime resistance at ¥113.93-113.07, an area clipped to the upper boundary of weekly supply, remains active. Though territory north of here brings light to noted weekly resistance from ¥114.38, working with two 1.272% Fibonacci projections on the daily scale at ¥114.12 and ¥114.48.
From the relative strength index (RSI), following support emerging from 56.85 early last week, the indicator’s value continues exploring overbought space. However, with the trend facing northbound this year, overbought signals should be viewed in this context.
H4 timeframe:
Selling has so far been thin at channel resistance, extended from the high ¥112.05, despite additional confluence in the form of a 100% Fibonacci projection at ¥113.74 and a 1.618% Fibonacci expansion at ¥113.90.
Sellers coming to life has support to target at ¥112.63, dovetailing closely with channel support, drawn from the low ¥109.12. While navigating north draws the possibility of reaching for weekly resistance at ¥114.38.
H1 timeframe:
Unable to shake hands with the decision point at ¥112.87-113.03, resistance at ¥113.71 made its way back into the spotlight in recent hours. This suggests healthy support in this market, with a break to ¥114 possibly unfolding. It should be noted that the psychological barrier is situated nearby the daily timeframe’s 1.272% Fibonacci projection at ¥114.12.
Observed Technical Levels:
GBP/USD:
Weekly timeframe:
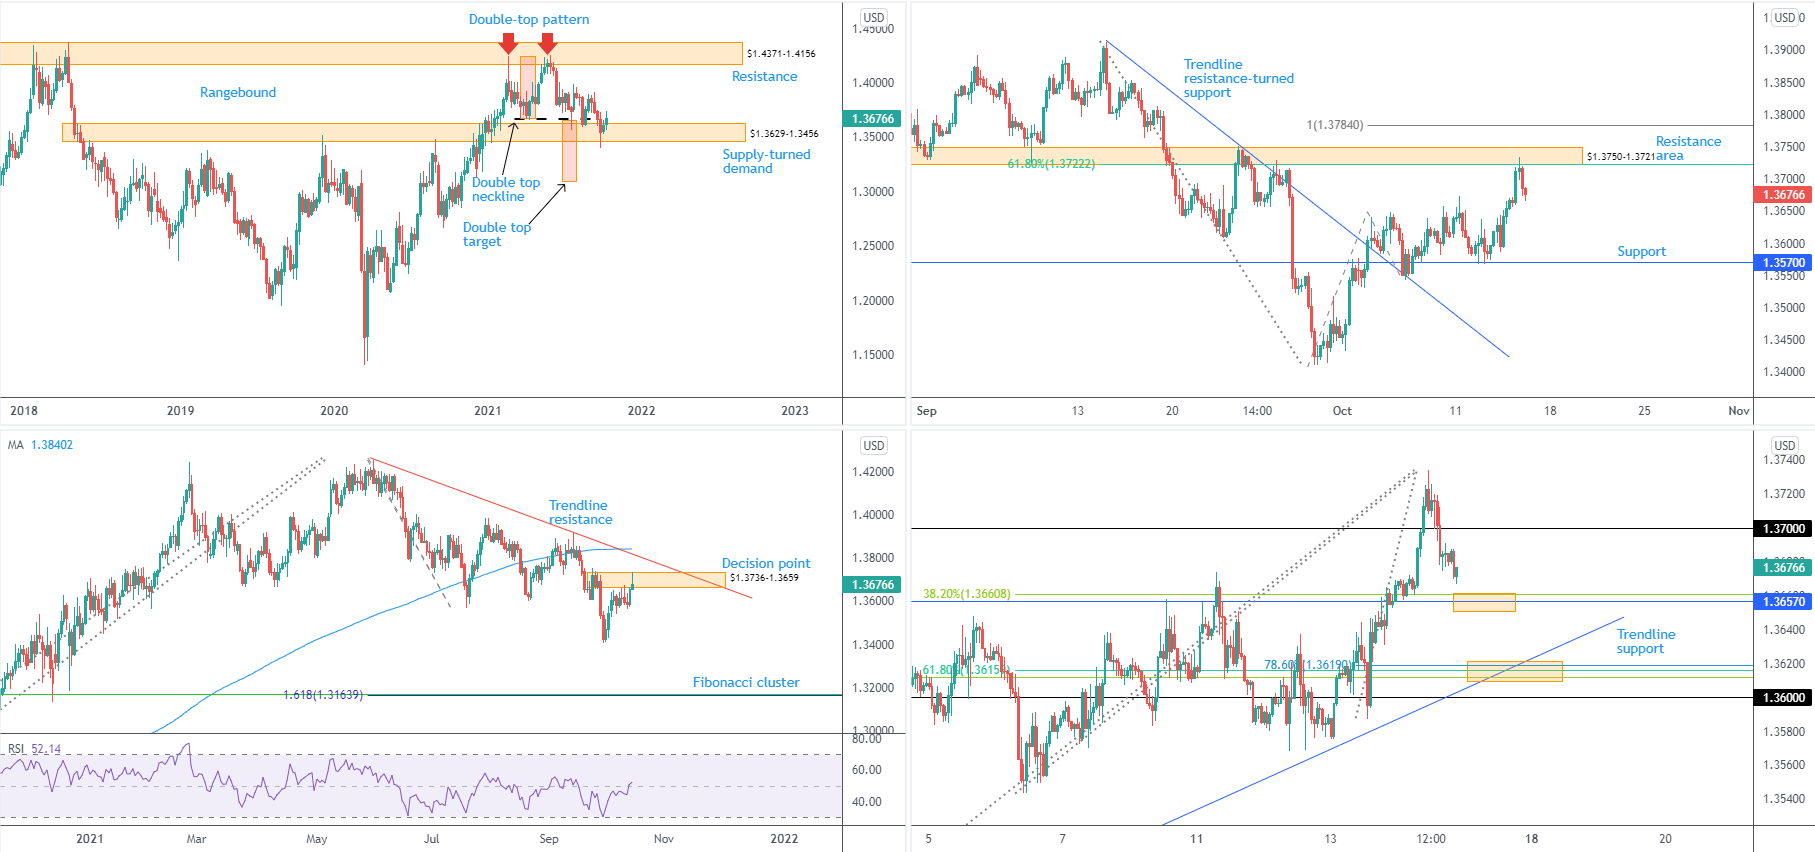
Supply-turned demand at $1.3629-1.3456 continues to emphasise a distressed atmosphere after having its lower limits clipped at the end of September. In spite of the recent recovery, it’s important to note price also closed below a double-top pattern’s ($1.4241) neckline at $1.3669, signalling bears are looking to take charge.
The double-top pattern’s profit objective—measured by taking the distance between the highest peak to the neckline and extending this value lower from the breakout point—sits around $1.3093. Conservative pattern sellers are likely to pursue a candle close beneath $1.3629-1.3456 before pulling the trigger.
Daily timeframe:
The $1.3736-1.3659 decision point remains an important area in this market. Respecting the aforementioned decision point helps confirm bearish intent within the weekly timeframe’s supply-turned demand at $1.3629-1.3456, and reinforces the idea of a successful double-top pattern.
Trendline resistance, taken from the high $1.4250, and the 200-day simple moving average at $1.3840 are seen above the current decision point; below is the $1.3412 low (29th September), with subsequent selling highlighting a Fibonacci cluster (support) around $1.3164.
From the relative strength index (RSI), the indicator’s value is attempting to secure position above the 50.00 centreline. Clearing the latter informs market participants momentum is to the upside: average gains exceed average losses.
H4 timeframe:
Resistance at $1.3750-1.3721 welcomed sellers Thursday. Aided by a 61.8% Fibonacci retracement at $1.3722, GBP/USD delivered a one-sided H4 bearish candle. Further selling has support in view at $1.3570. while buyers entering the fight places the 100% Fibonacci projection at $1.3784 in view.
H1 timeframe:
Finishing the session considerably off best levels, GBP/USD is now on the doorstep of support coming in from $1.3657, aligning closely with a 38.2% Fibonacci retracement at $1.3661 (green). Space beneath the noted supports casts light towards trendline support, etched from the low $1.3415. Interestingly, this ascending base converges with a collection of Fibonacci retracement levels between $1.3612 and $1.3619.
Observed Technical Levels:
In addition to the weekly timeframe’s supply-turned demand at $1.3629-1.3456 echoing weakness, the daily timeframe’s decision point at $1.3736-1.3659 uniting with H4 resistance at $1.3750-1.3721 could prove troublesome for H1 buyers off support at $1.3657, and H1 trendline support.
H1 interest from the aforementioned levels, therefore, are urged to trade cautiously and perhaps consider waiting for additional price confirmation before pulling the trigger.
Author

Aaron Hill
FP Markets
After completing his Bachelor’s degree in English and Creative Writing in the UK, and subsequently spending a handful of years teaching English as a foreign language teacher around Asia, Aaron was introduced to financial trading,


