Dollar dips as investors take profits ahead of FOMC meeting

The US dollar recently retreated as investors capitalised on upbeat US economic data before the Federal Reserve's forthcoming policy meeting, where 97% anticipate interest rates will remain stable.
The US dollar recently retreated as investors capitalised on upbeat US economic data before the Federal Reserve's forthcoming policy meeting, where 97% anticipate interest rates will remain stable. Simultaneously, gold rebounded after a brief dip, oil prices surged for a third week on supply constraints and Chinese demand. On another front, the Euro is under intense scrutiny in the aftermath of the European Central Bank's resolute tightening of monetary policy, stoking uncertainties about its potential impact. Meanwhile, the Japanese Yen struggled despite hawkish remarks from the Bank of Japan, reflecting concerns over Japan's economy and currency depreciation amplifying foreign-debt risks.
Market movements
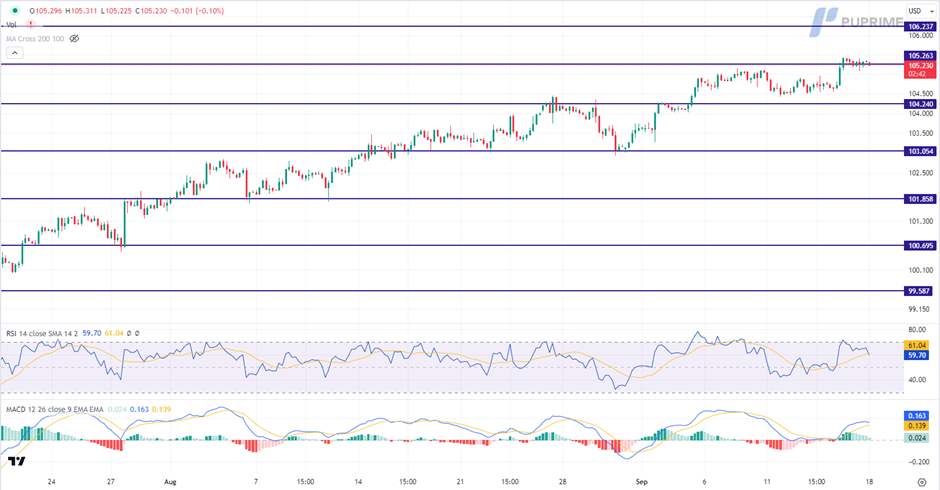
Dollar index
The US dollar recently retreated from its highest level as savvy investors seized the opportunity to lock in profits following a series of encouraging economic data releases from the United States. This retreat comes as market players shift their focus to the impending monetary policy meeting of the Federal Reserve, eagerly awaiting the release of key trading signals. According to the CME Group FedWatch Tool, an overwhelming 97% of investors anticipate that interest rates will remain firmly anchored within the 5.25% to 5.50% range after the September 20 Federal Reserve FOMC meeting.
The dollar Index is trading higher while currently testing the resistance level. However, MACD has illustrated diminishing bullish momentum, while RSI is at 60, suggesting the index might experience technical correction since the RSI retreated sharply from overbought territory.
Resistance level: 105.25, 106.25.
Support level: 104.25, 103.05.
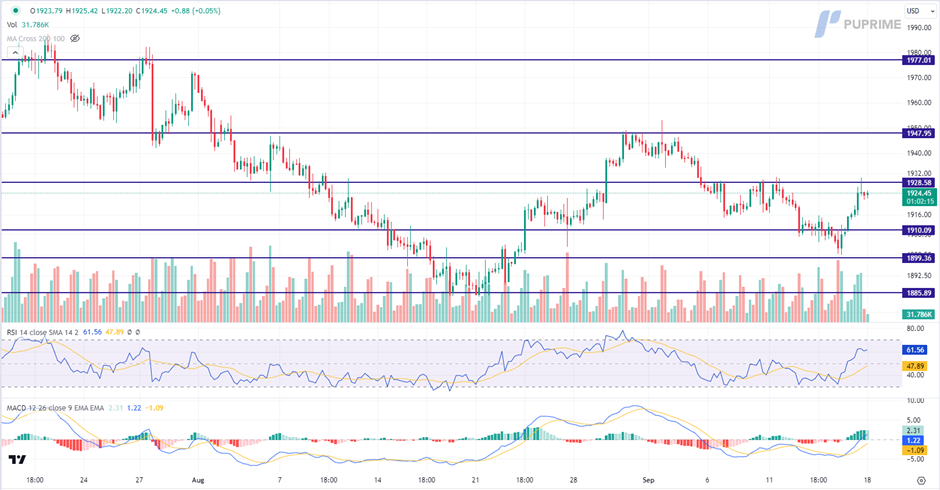
XAU/USD
Gold prices experienced a significant rebound, displaying a remarkable technical correction after encountering a critical support level at $1,900 per troy ounce. It's worth noting that gold had previously experienced a sharp dip following the release of upbeat inflation reports. However, the current market sentiment has tilted decisively toward monitoring the Federal Reserve's monetary policy decisions.
Gold prices are trading higher while currently testing the resistance level. MACD has illustrated increasing bullish momentum, while RSI is at 62, suggesting the commodity might extend its gains after breakout since the RSI stays above the midline.
Resistance level: 1930.00, 1950.00.
Support level: 1910.00, 1900.00.
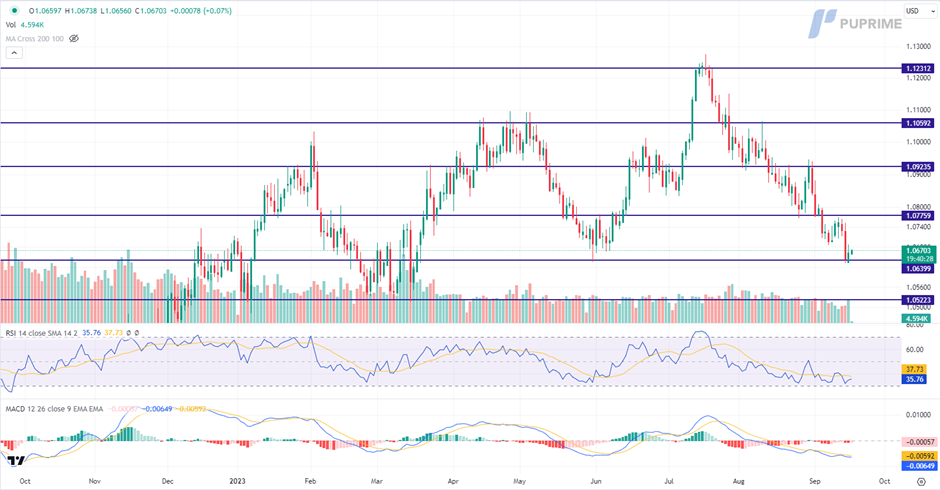
EUR/USD
In the aftermath of the European Central Bank's recent rate hike decisions, all eyes are on the Euro as a critical signal of whether the tightening monetary policies adopted by ECB members will exacerbate recession risks. Investor confidence in the latest monetary policy directives from the European Central Bank has waned, marking its longest losing streak to date.
EUR/USD is trading lower while currently testing the support level. MACD has illustrated diminishing bearish momentum, while RSI is at 36, suggesting the pair might enter oversold territory.
Resistance level:1.0775, 1.0925.
Support level: 1.0640, 1.0520.
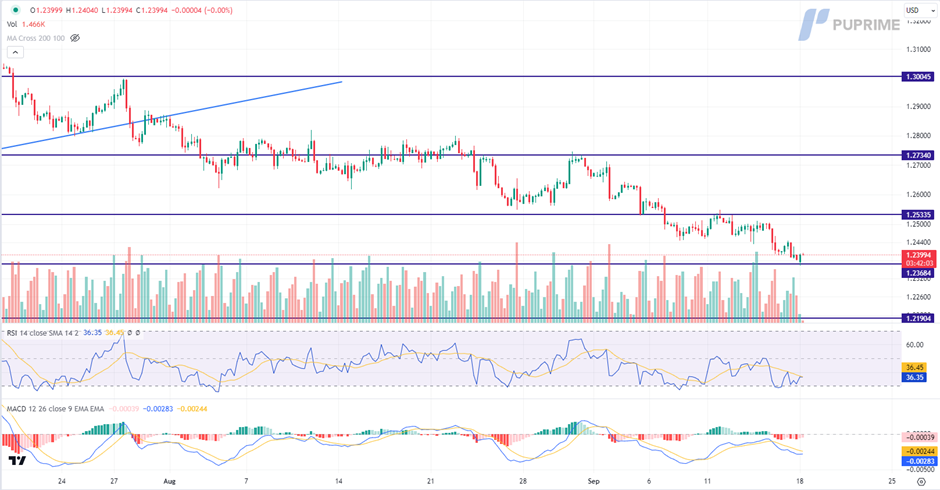
GBP/USD
The Pound Sterling continues its bearish trend amid persistently high inflation and the looming threat of recession. This economic turmoil has stunted growth, left wages stagnant since 2008, and pushed the national debt to worrisome levels, casting a shadow over the Pound's prospects.
Pound Sterling is trading lower while currently testing the support level. However, MACD has illustrated diminishing bearish momentum, while RSI is at 36, suggesting the pair might experience technical correction since the RSI rebounded sharply from oversold territory.
Resistance level: 1.2535, 1.2735.
Support level: 1.2370, 1.2190.
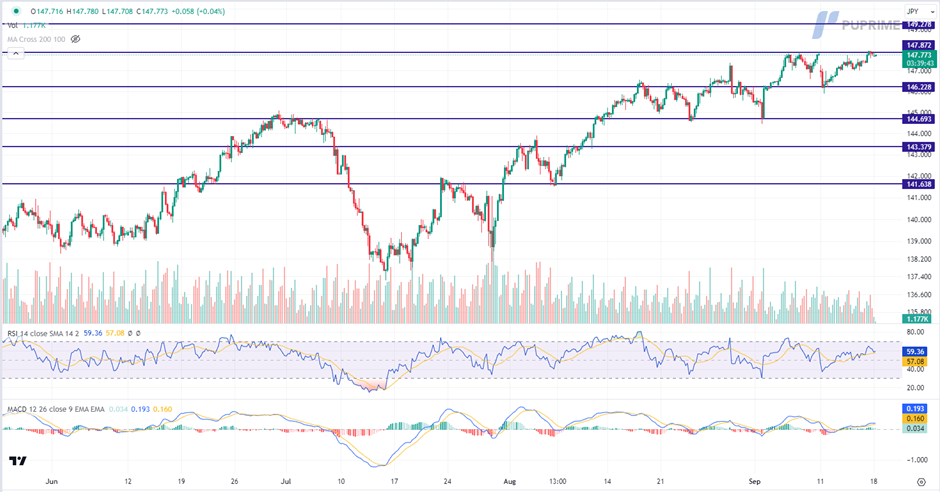
USD/JPY
Despite Bank of Japan Governor Kazuo Ueda's hawkish remarks last week, the Japanese yen relinquished all its gains. Investors continue to harbour pessimism concerning Japan's economic outlook, exacerbated by the ongoing depreciation of the currency, which has amplified foreign-debt risks for the nation.
USD/JPY is trading higher while currently testing the resistance level. However, MACD has illustrated diminishing bullish momentum, while RSI is at 59, suggesting the pair might experience technical correction since the RSI retreated sharply from overbought territory.
Resistance level: 147.85, 149.30.
Support level: 146.25, 144.70.
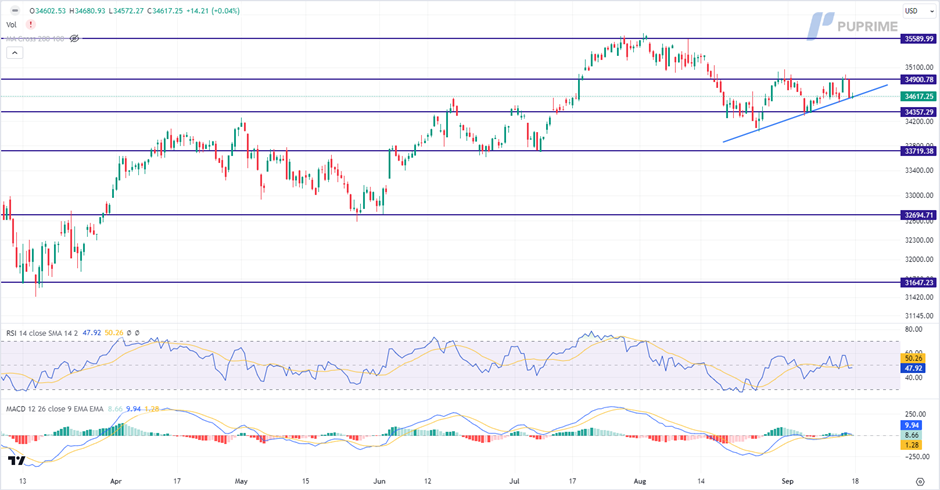
Dow jones
The US equity market experienced a notable downturn last Friday as investors braced themselves for another potentially volatile week ahead of the Federal Reserve's policy meetings. The Dow Jones Industrial Average, a key indicator, dipped by 288.87 points, equivalent to a 0.83% decline, settling at 34,614.24. As the market grapples with mixed economic data in anticipation of the Fed's policy decision on September 20, investors are keen to glean insights into policymakers' perspectives on inflation and its potential implications.
The Dow is trading lower following the prior retracement from the resistance level. MACD has illustrated diminishing bullish momentum, while RSI is at 48, suggesting the index might extend its losses after breakout below the upward trendline since the RSI stays below the midline.
Resistance level: 34900.00, 35590.00.
Support level: 34355.00, 33720.00.
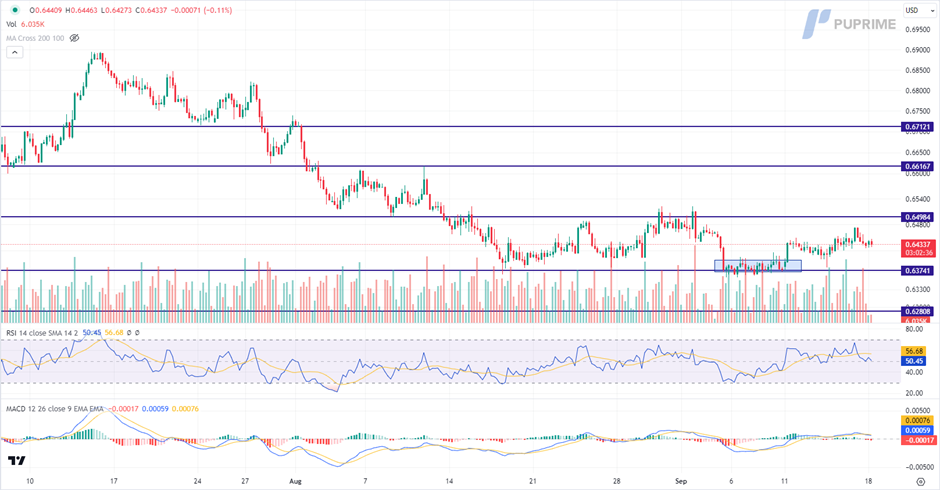
AUD/USD
Upbeat economic data out of China, including a stronger-than-expected 4.6% growth in Retail Sales for August reported by China's National Bureau of Statistics, is boosting confidence in Chinese proxy currencies, notably the Australian dollar. These encouraging signs suggest an uptick in economic activity and have significant implications for Australia, given its substantial trading ties with China.
AUD/USD is trading higher following the prior rebound from the support level. However, MACD has illustrated increasing bearish momentum, while RSI is at 50, suggesting the pair might experience technical correction since the RSI retreated sharply from overbought territory.
Resistance level: 0.6500, 0.6615.
Support level: 0.6375, 0.6280.
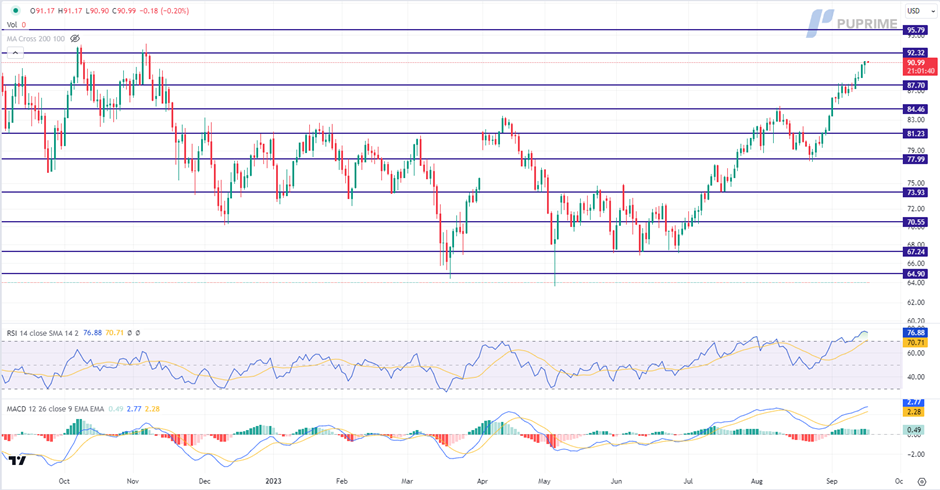
CL Oil
Oil market witnessed its third consecutive weekly gain. This surge can be attributed to supply tightness, primarily driven by Saudi Arabia production cuts, coupled with optimistic expectations of increased demand from China. Investors are closely monitoring Saudi Arabia and Russia's decisions regarding the extension of their combined supply cuts, amounting to 1.3 million barrels per day, through the end of the year. Additionally, data from last Friday indicated a substantial 20% year-on-year increase in Chinese oil refinery processing, as processors ramp up production to capitalise on the robust global demand for oil products.
Oil prices are trading higher while currently near the resistance level. However, MACD has illustrated diminishing bullish momentum, while RSI is at 77, suggesting the commodity might enter overbought territory.
Resistance level: 92.30, 95.80.
Support level: 87.70, 84.45.
Author

PU Prime team
PU Prime
PU Prime is an award-winning CFD broker offering clients access to multiple products across multiple asset classes. Traders will have access to FX, Commodities, Indices, Share CFDs and Bonds.


