DIS (Walt Disney): A possible huge move coming across the market

Many stock tickers and Indices across the world are showing five waves within the Grand Super Cycle. Many Elliott Wave practitioners will be looking for a crash or big three waves across the Market. We at EWF always correlate the Market because, in the end, there is only 1 market and they work in sync. We see Indices like $FTSE, which does not support the five waves within the Grand Super Cycle. Instead, it calls for a nest into a huge Bullish cycle, even more significant than the one from 2009-2020.
FTSE Monthly Elliott Wave Chart
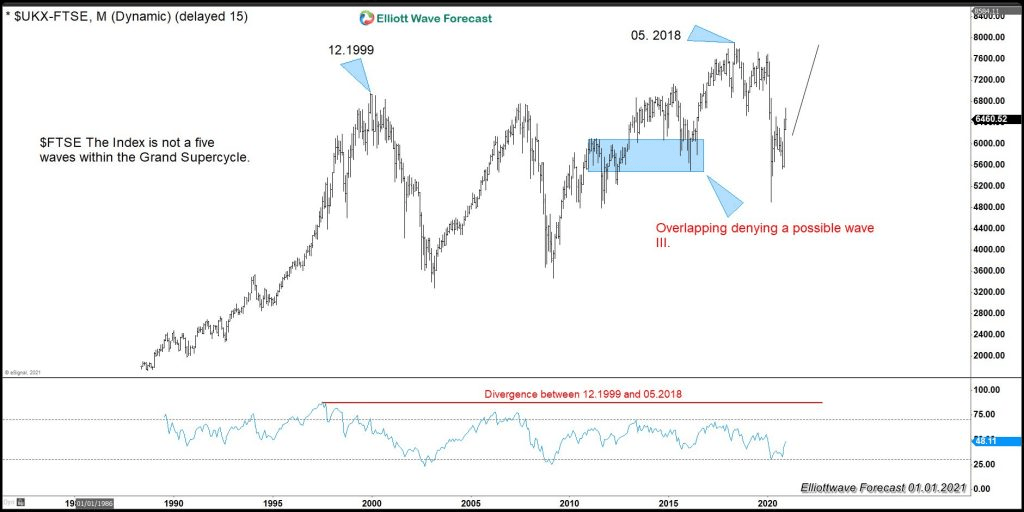
The monthly chart of $FTSE above shows the Grand Super Cycle. It also shows the overlap from the cycle since 2009, which denies the possibility of a five waves advance since all-time lows. We have seen many times in the past five waves become a nest, and many traders get caught in the wrong side selling a wave five. We have developed a system that will determine when to switch from a five waves advance and three waves pullback scenario to an extended nest. The RSI is vital, and knowing how to read it can be the difference between catching a strong wave III or attempting to fade a strong trend.
In Elliott wave theory, in an impulsive structure, wave III should have the highest momentum. Wave V momentum should show a negative divergence to wave III. The following chart below illustrates the idea:
$SPY Monthly Elliott Wave Chart
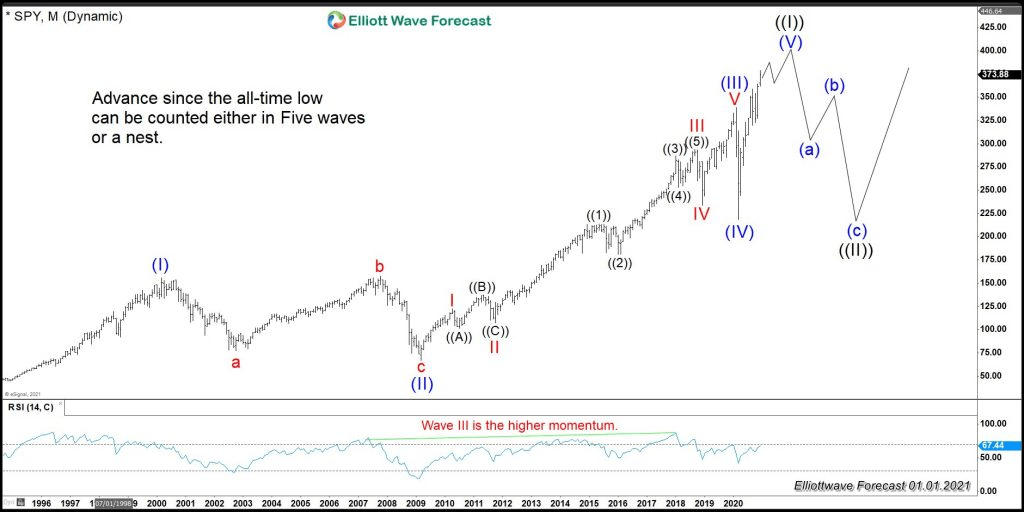
The chart above shows the advance in the $SPY since the all-time lows. The chart above can trap many shorts who try to fade the move. As we can see, the RSI highest momentum happens in wave (III), and wave (V) shows divergence against wave (III) peak. Thus, SPY wave structure can be a five waves advance since the all-time lows. As we mentioned above however, sometimes five waves can become a nest. We show the nest in the following chart:
$SPY Quarterly Elliott Wave Chart
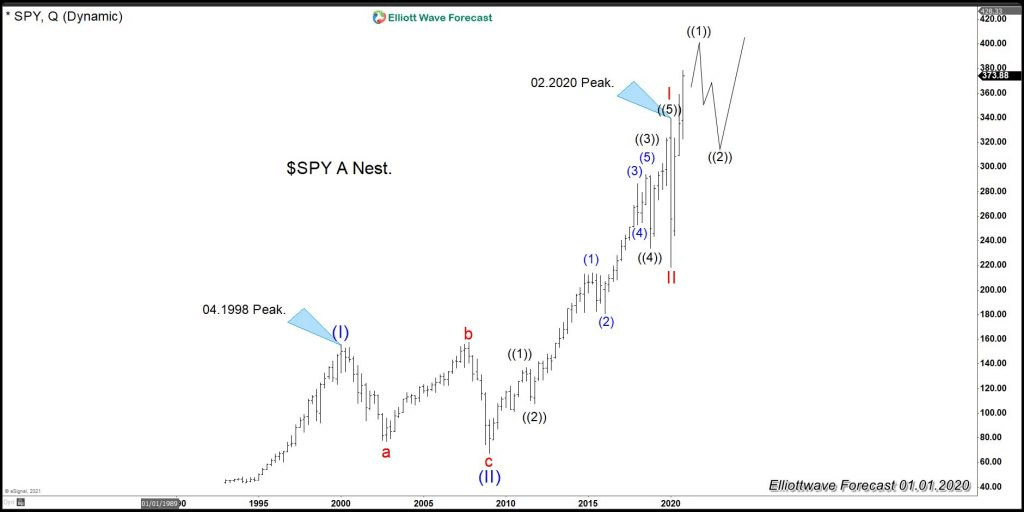
A nest is nothing more than the market creating energy into an extended break or extension within one of the three impulses. Relating the nest to the $SPY, wave (III) can become wave I, and consequently, a big move will happen in the years to come. Let’s take a look at $DIS (Walt Disney Company) chart below. The wave structure of $DIS looks very similar to that of $SPY, but there are significant differences between the two when it comes to the RSI.
Walt Disney Company ($DIS) Quarterly Elliott Wave Chart
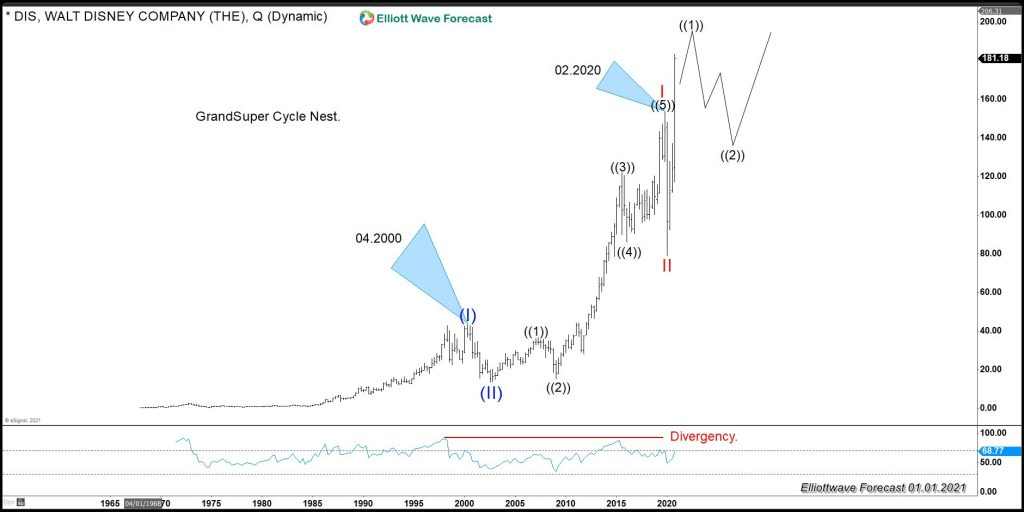
Walt Disney ($DIS) Quarterly chart above shows a nest and the reason why. First, we can see a vertical move since the 03.2020 lows, which is usually an indication of a wave III. If the nest is the right count, then we should be within ((1)), which is only the first leg of wave III, with a huge follow-up move coming. The divergence between the peak at 02.2020 and current highs still remains in place for now.
Secondly, we can see the divergence between the peak at 04.1998 and the peak at 02.2020. Ideally, that is a sign of a nest and something to keep into consideration. As we mentioned above, many Indices and stocks across the market are either not five waves within the Grand Super Cycle or do not have space to decline like the one in 2020. The next few months will be critical to determine whether it’s a nest or crash. The current data however is pointing into the NEST.
Author

Elliott Wave Forecast Team
ElliottWave-Forecast.com


