Today‘s data should work in a hawkish Fed confirmation way

S&P 500 acted on Tue‘s tech internals clue, and its decline into the opening bell and early session was stopped by tech market breadth improving while the usual suspects (chiefly retail and materials) continued clear downtrends. Industrials, financials and Russell 2000 haven‘t so far broken below key respective lows.
Overall, the nature of the rebound was defensive (select tech, communications, utilities, staples and healthcare) did well, which together with bond market reprieve gives good odds of ES bulls not throwing in the towel today – tight range, possibly setting up for sell the debt ceiling bill news.
The sectors to be still in if looking for earnings justification, is communications and consumer discretionaries – similarly to Big Tech not bid up to the stratosphere on P/E count, these three (with non-banking financials) will be most resilient when tighter financial conditions following debt ceiling resolution strike. Even the latest round of Fed speakers raised their case for bullish pause in June, claiming that Fed funds rate isn‘t yet at the terminal level, thereby making Jun 25bp hike not the base case scenario. Looking though at relative core inflation data stagnation (poor disinflation there), I don‘t think 25bp hike should be written off really – and as you‘ll read below on the job market data expectations, it‘s looking correct.
Let‘s move right into the charts – today‘s full scale article contains 3 of them.
S&P 500 and Nasdaq outlook
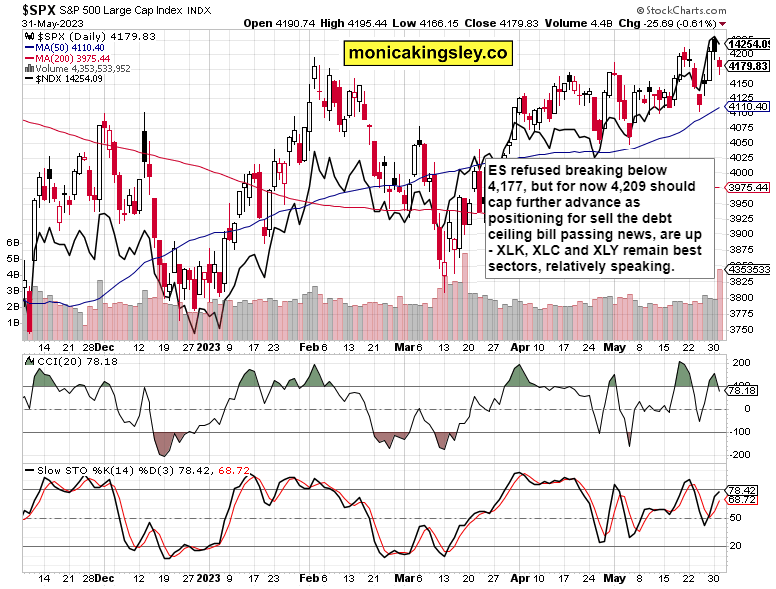
Strong volume, but animal spirits aren‘t there, no strong base advance. Today‘s data should work in a hawkish Fed confirmation way, but the buyers will be able to close not only above 4,188, but also below 4,209 unless Big Tech erases at least half of its two-day decline. Odds are tech would accomplish that mission, but the weakening rotations wouldn‘t do all that much for the lagging sectors, keeping ES around the 4,198 level at best for any buyers out there.
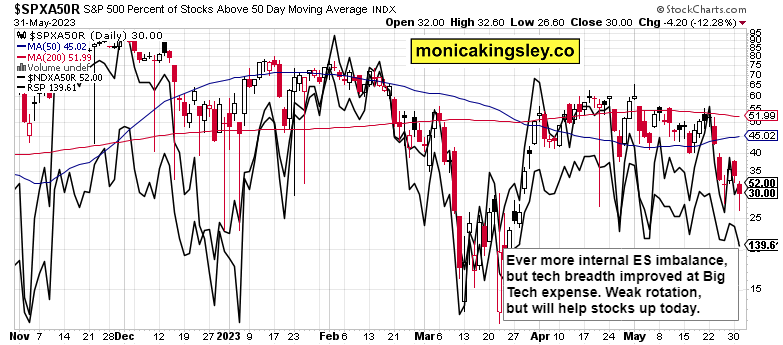
The market breadth for the whole S&P 500 is terrible, and even the Nasdaq breadth is unhealthy. I‘m giving limited mileage to the lower knot shown on the chart for S&P 500 stocks trading above their 50-day moving average.
Author

Monica Kingsley
Monicakingsley
Monica Kingsley is a trader and financial analyst serving countless investors and traders since Feb 2020.


