DAX: The MACD is showing a possible cross over while the RSI is reporting negative divergence
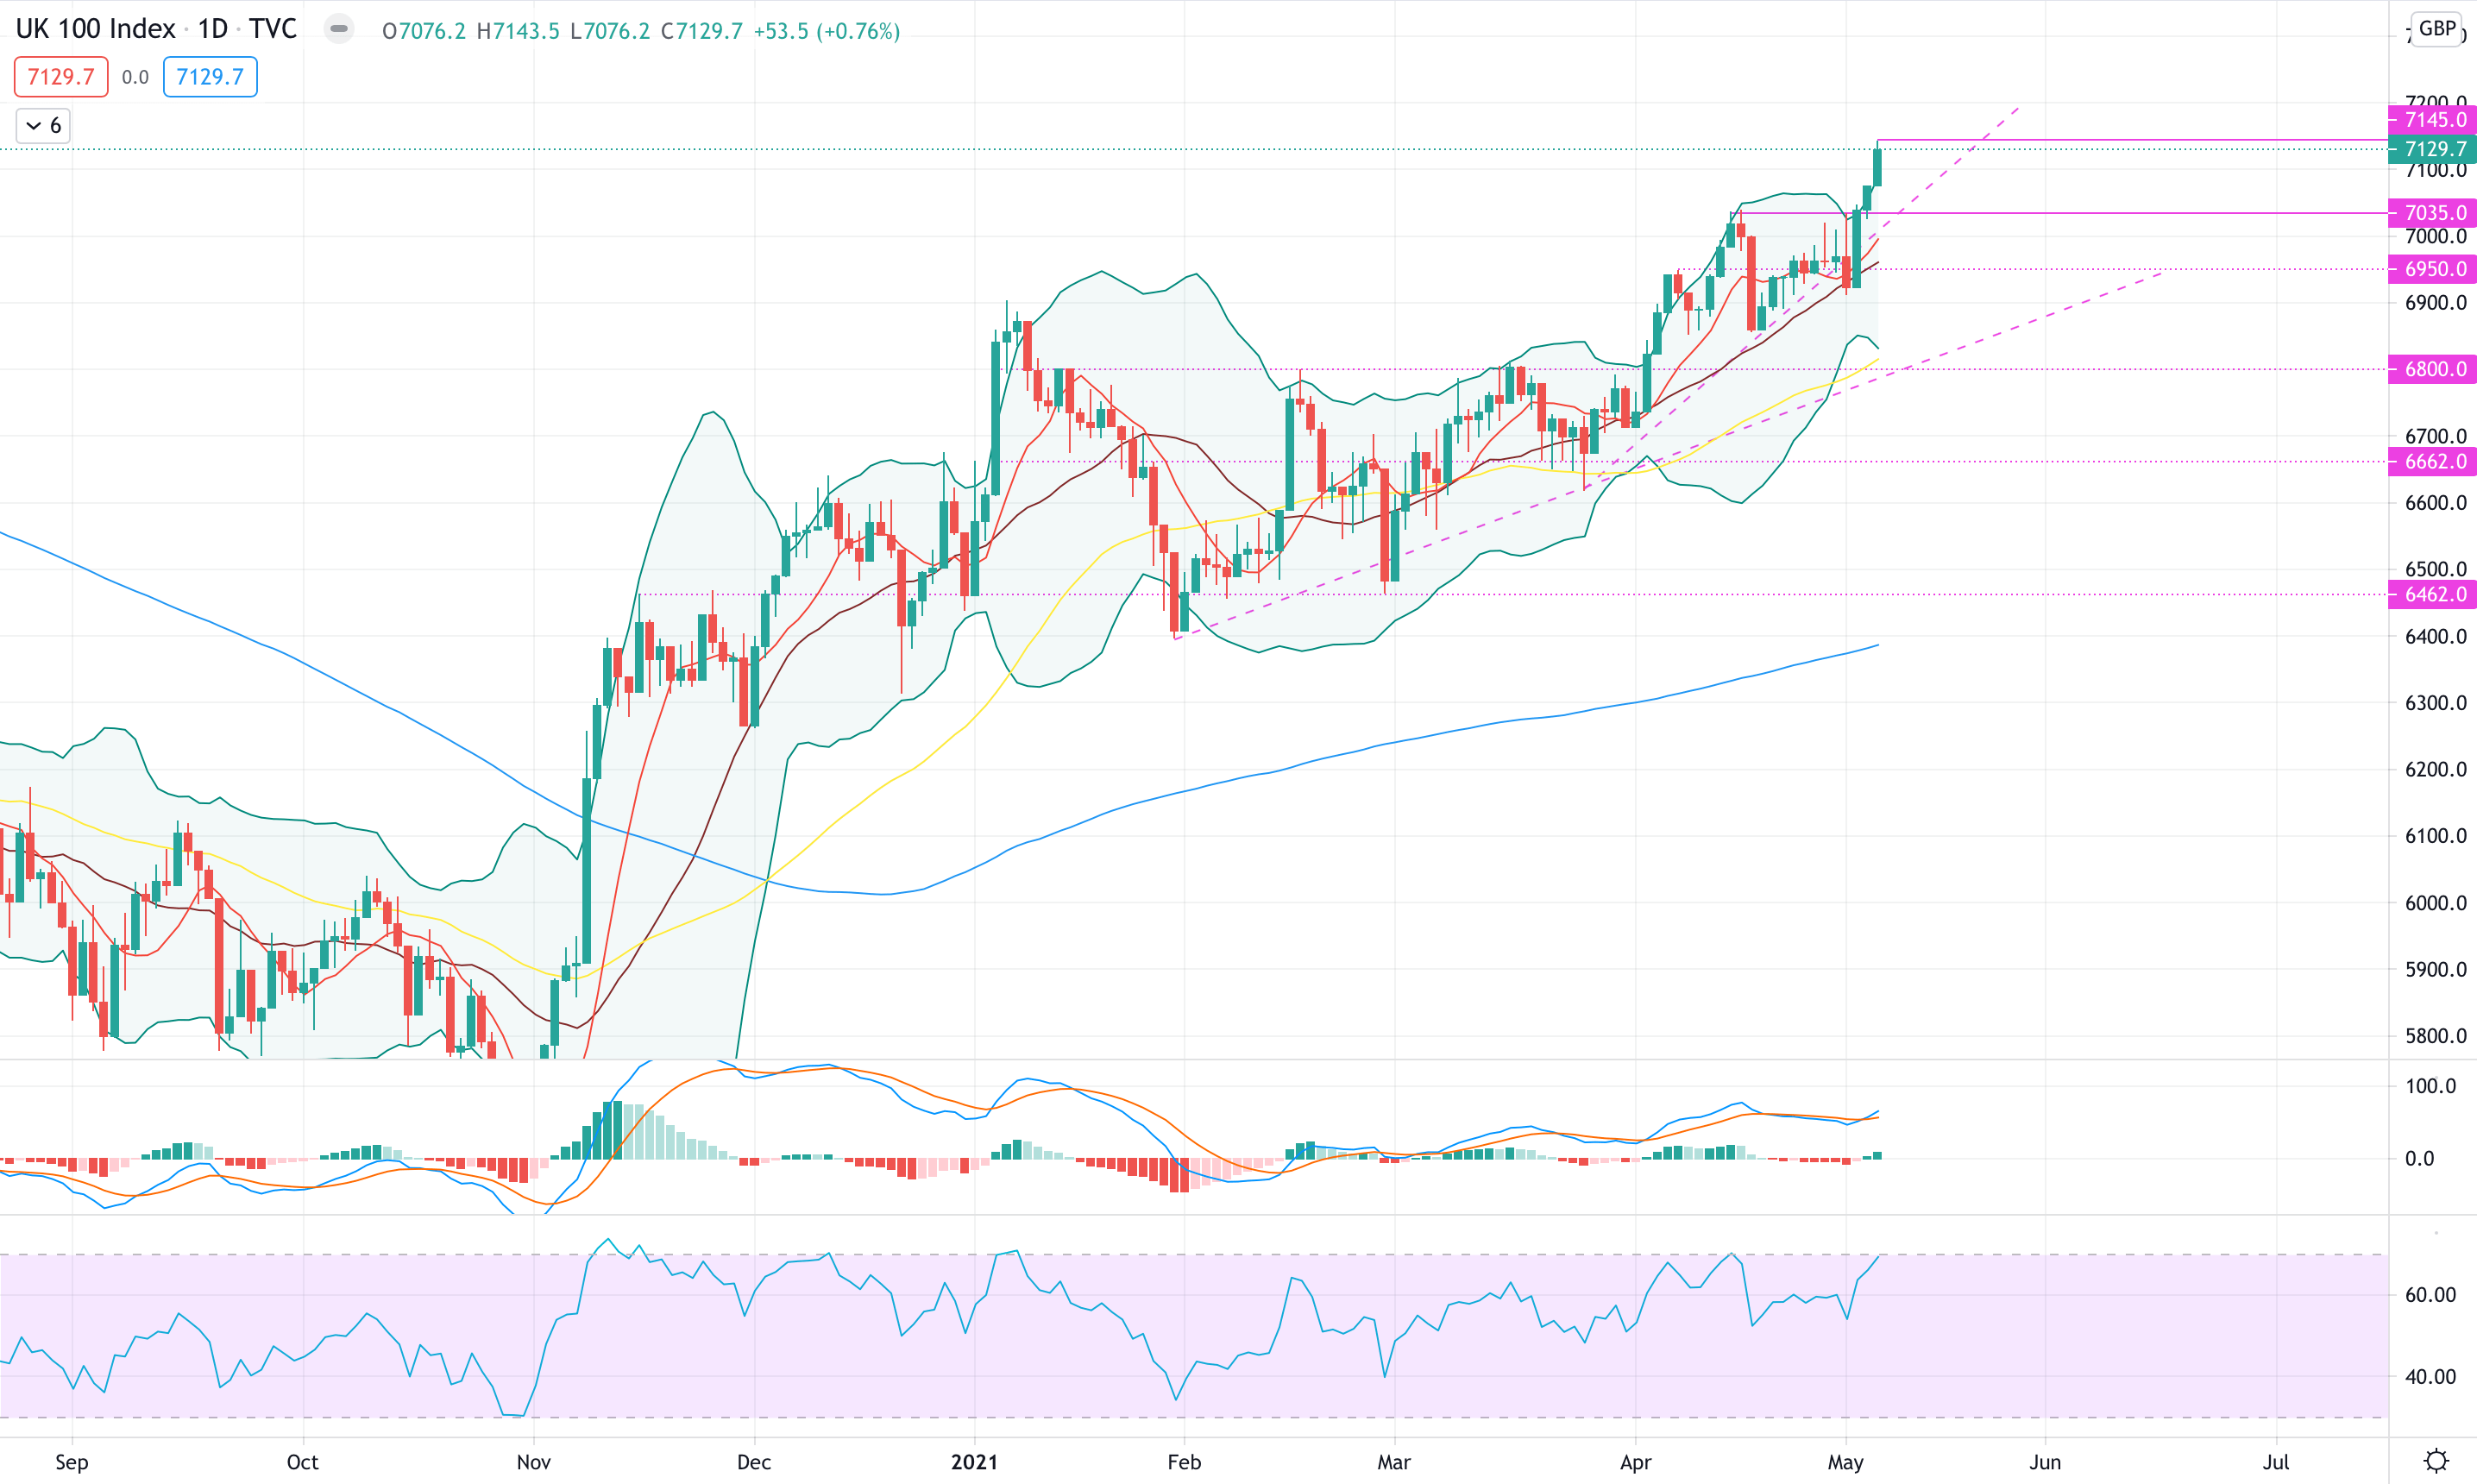
FTSE 100 (#UKX)
The #UKX had a positive week up +2.17% where it managed to strongly break above the 7,000 level.
From a technical perspective, we confirm the bullish context of the Index however we are in favour of healthy pullbacks in the near term.
The MACD crossed over but the RSI is showing negative divergence with the price: this could confirm how despite a strong move to the upside, the breath of the market is not as strong.
In addition, the #UKX is one of the few market that still did not reconcile with the 50MA: we will more in favour of further bullish moves once the indexes has retraced to the moving average.
For the week ahead, we believe the #UKX might retest the 7,000 mark before further moves: a break of current trendline might lead to additional downside moves.
Support at 7,035 and resistance at 7,145.
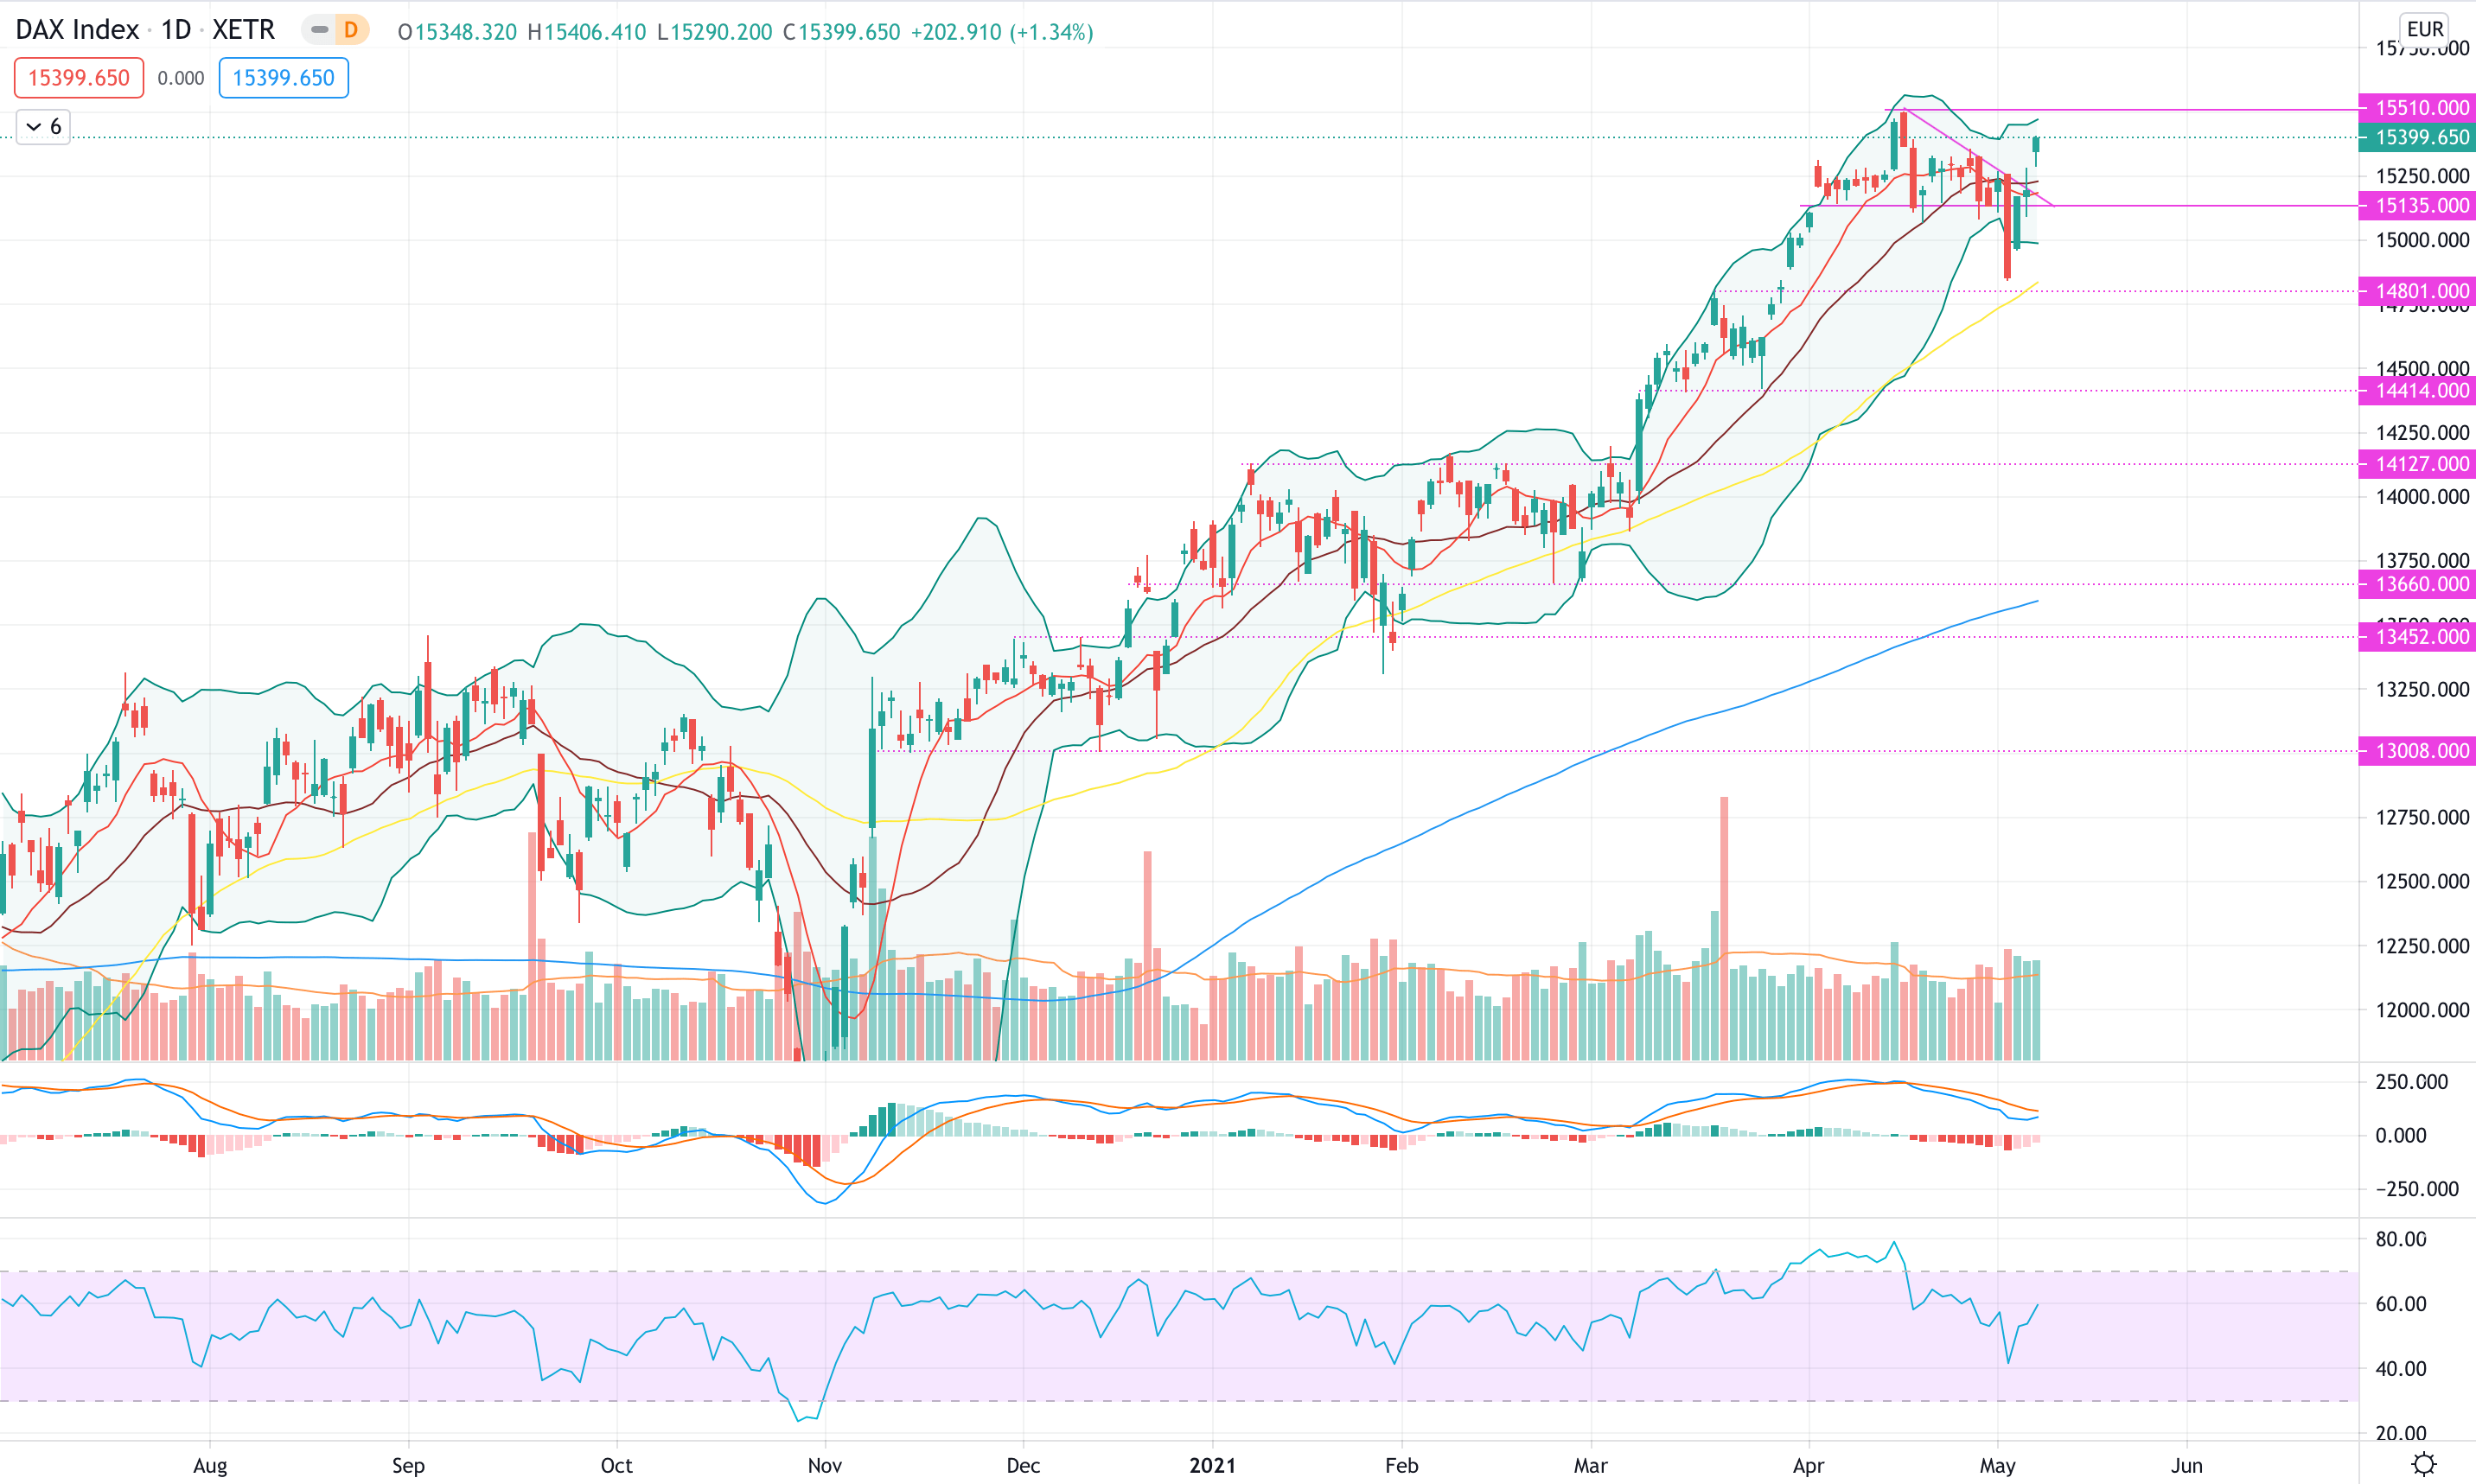
DAX (#DAX)
The #DAX had a positive week up +1.34% where it managed to break the descending triangle, as highlighted last week, and reverse to the upside.
From a technical perspective, the #DAX is respecting classing setup: it broke down the descending triangle to almost reconcile with the 50MA.
Once tested past resistance level, it strongly reversed to the upside ending the week with a strong bullish candle.
The MACD is showing a possible cross over while the RSI is reporting negative divergence with the price.
For the week ahead, given the strong volumes we believe the #DAX might retest current resistance before eventually reversed down given the divergence RSI-Price
Support at 15,135 and resistance at 15,510.
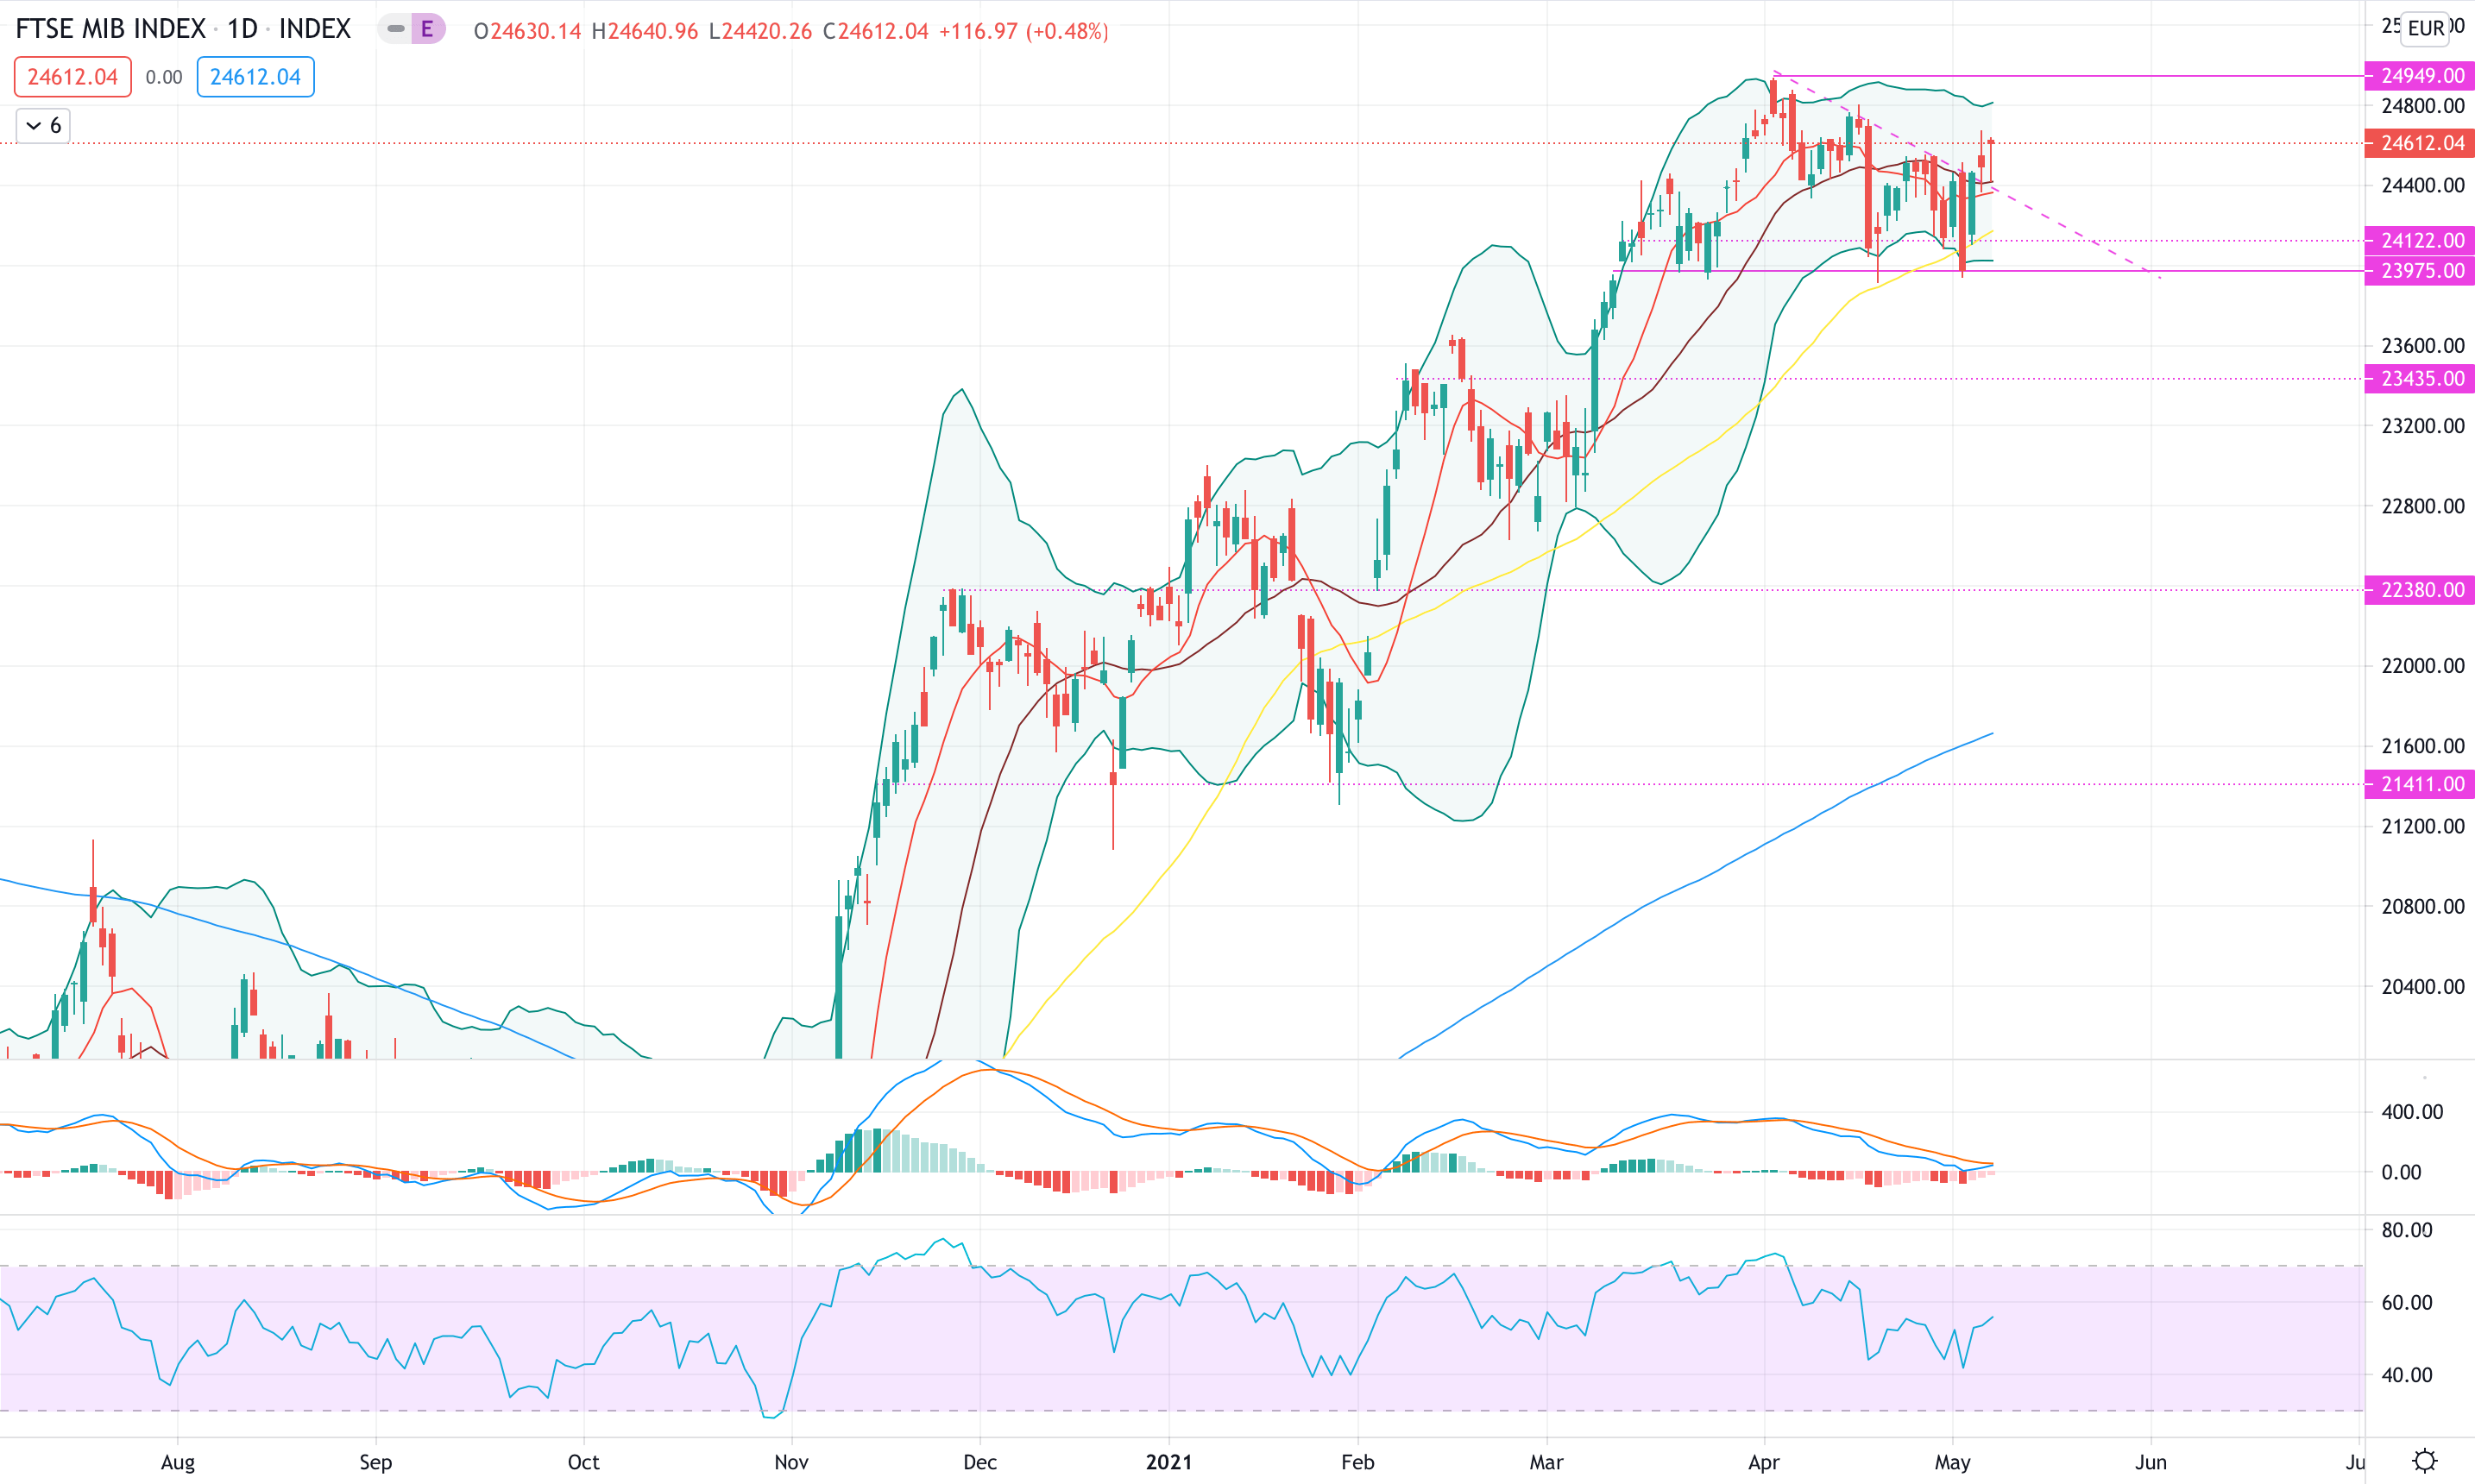
FTSEMIB (#FTSEMIB)
The #FTSEMIB had a positive week up +1.77% where it managed to confirm the horizontal channel that has been taking place since mid-March.
From a technical perspective, the setup is relatively healthy given the re-test of 50MA: the MACD is crossing up, however very closed to the 0 level, and the RSI is pointing to the upside .
For the week ahead, we might see a continuation to the upside until 24,800 before light pullbacks
Support at 23,975 and resistance at 24,949.
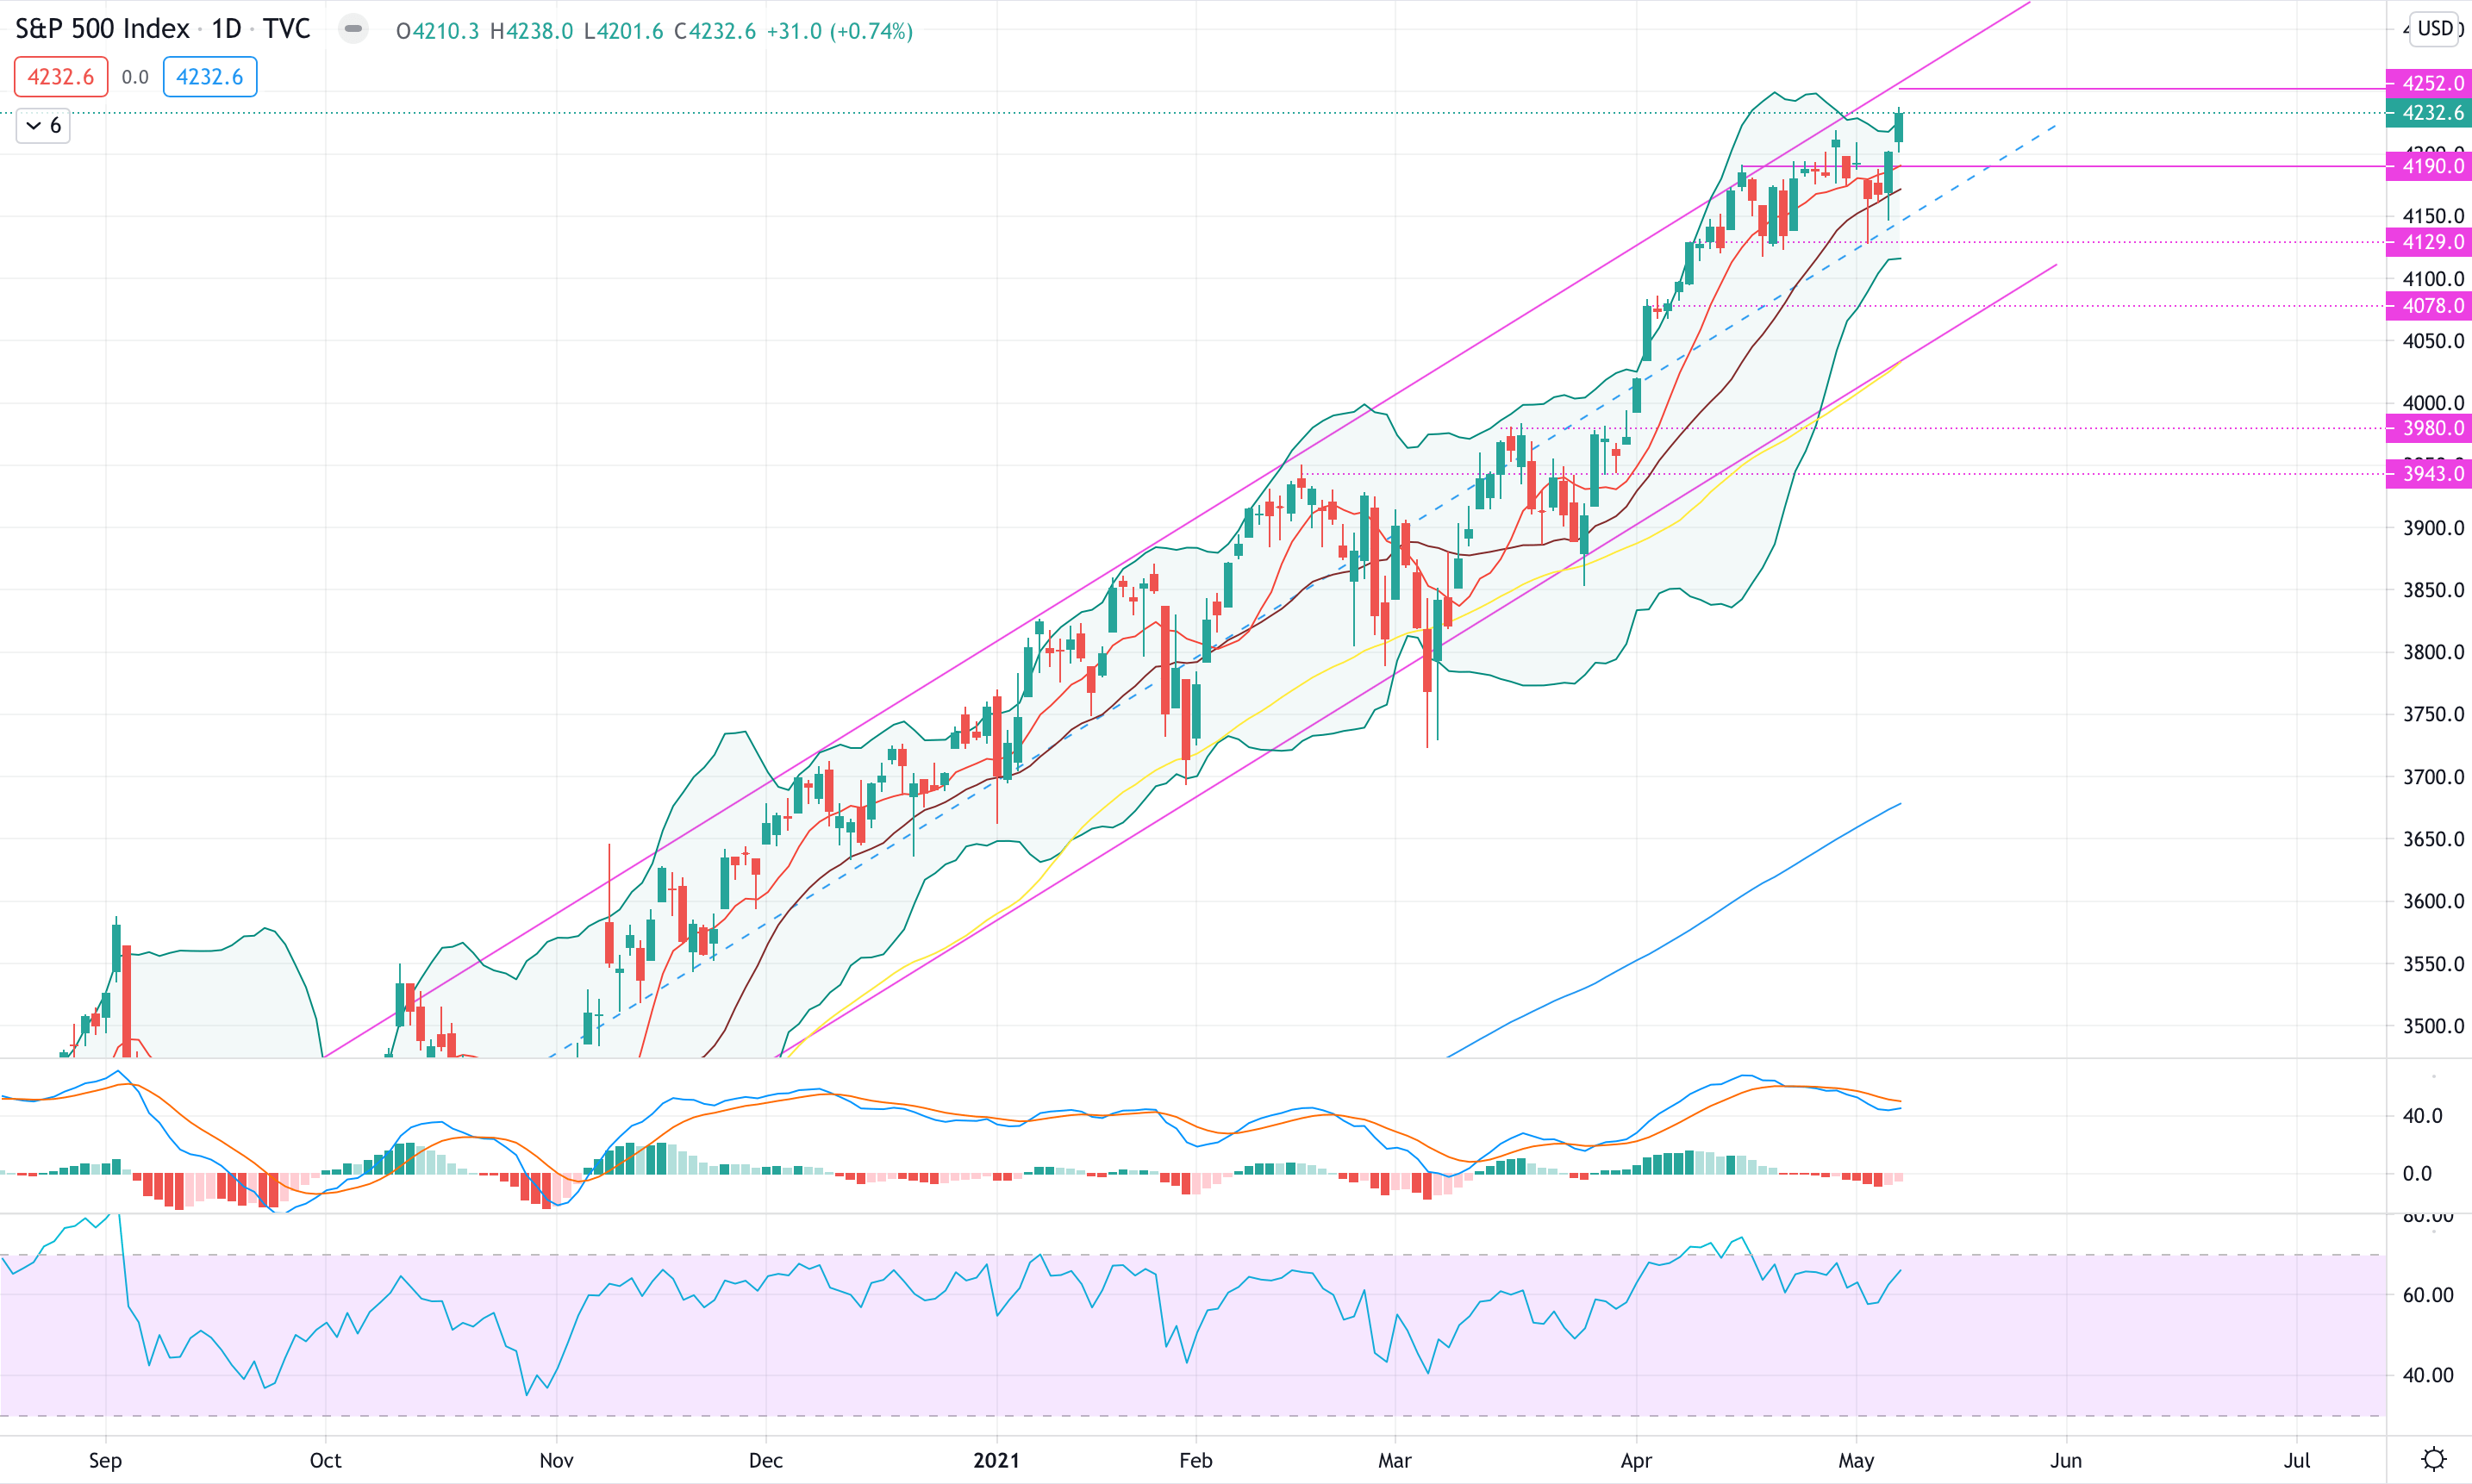
S&P 500 (#SPX)
The #SPX had a positive week up +0.67% and it is now at another record high.
From a technical perspective, the #SPX tested the 9MA and reversed to the upside confirming the bullish momentum. As of now, we came back to the upper end of the channel with a MACD that is possibly crossing over but a RSI that is showing negative divergence with the price.
We do believe the #SPX, despite being in bullish context, still has downside potential and the risk/reward ratio is still strongly to the downside.
For the week ahead, we might see a test current resistance before eventually reversed back down.
Support at 4,190 and resistance at 4,252.
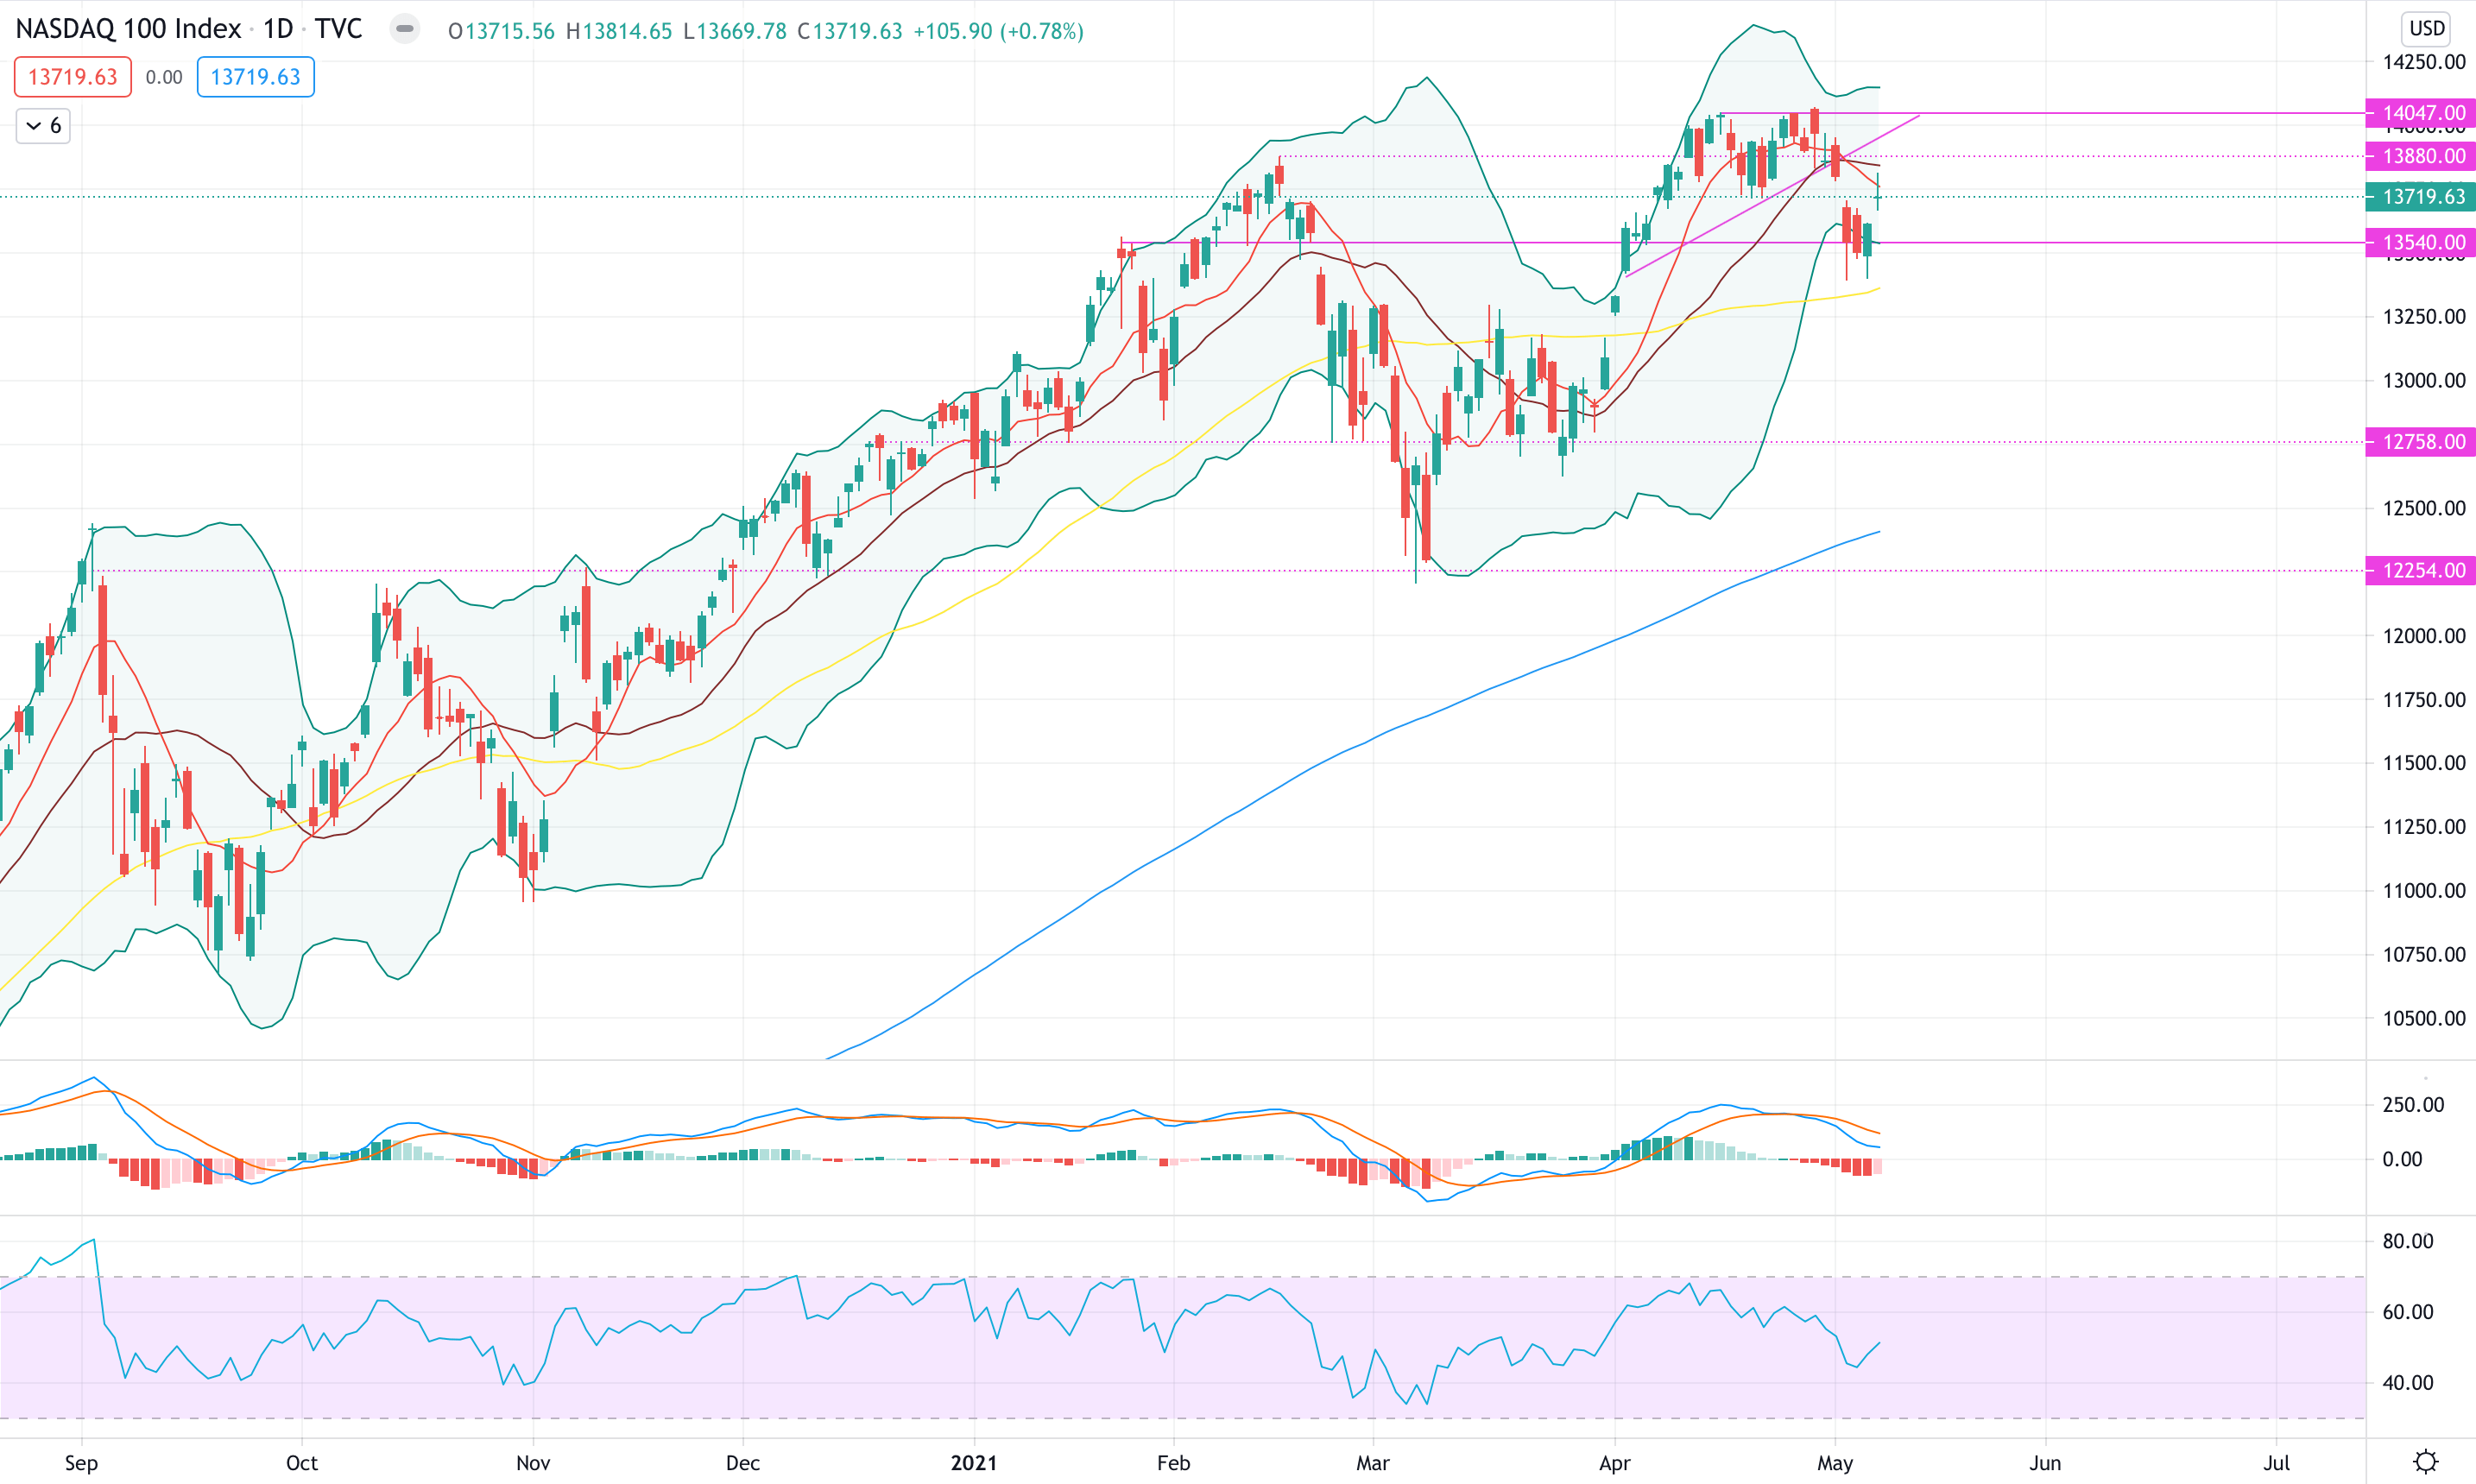
NASDAQ (#NDX)
The #NDX had a negative week down -1.44% closing once again just below the 9MA.
From a tecnica perspective, the selling pressure got stopped at the 50MA which could seen as positive signal. On the other side, the Friday candle got stopped by previous intermediate resistance.
Looking at the indicator, the MACD is gradually recovering together with an RSI that is pointing to the upside.
For the week ahead, a break of 13,800 might lead to a re-test of current resistance. In case the #NDX would get, once again, rejected at 13,800 we will see selling pressure until the 13,540 level.
Support at 13,540 and resistance at 14,047.
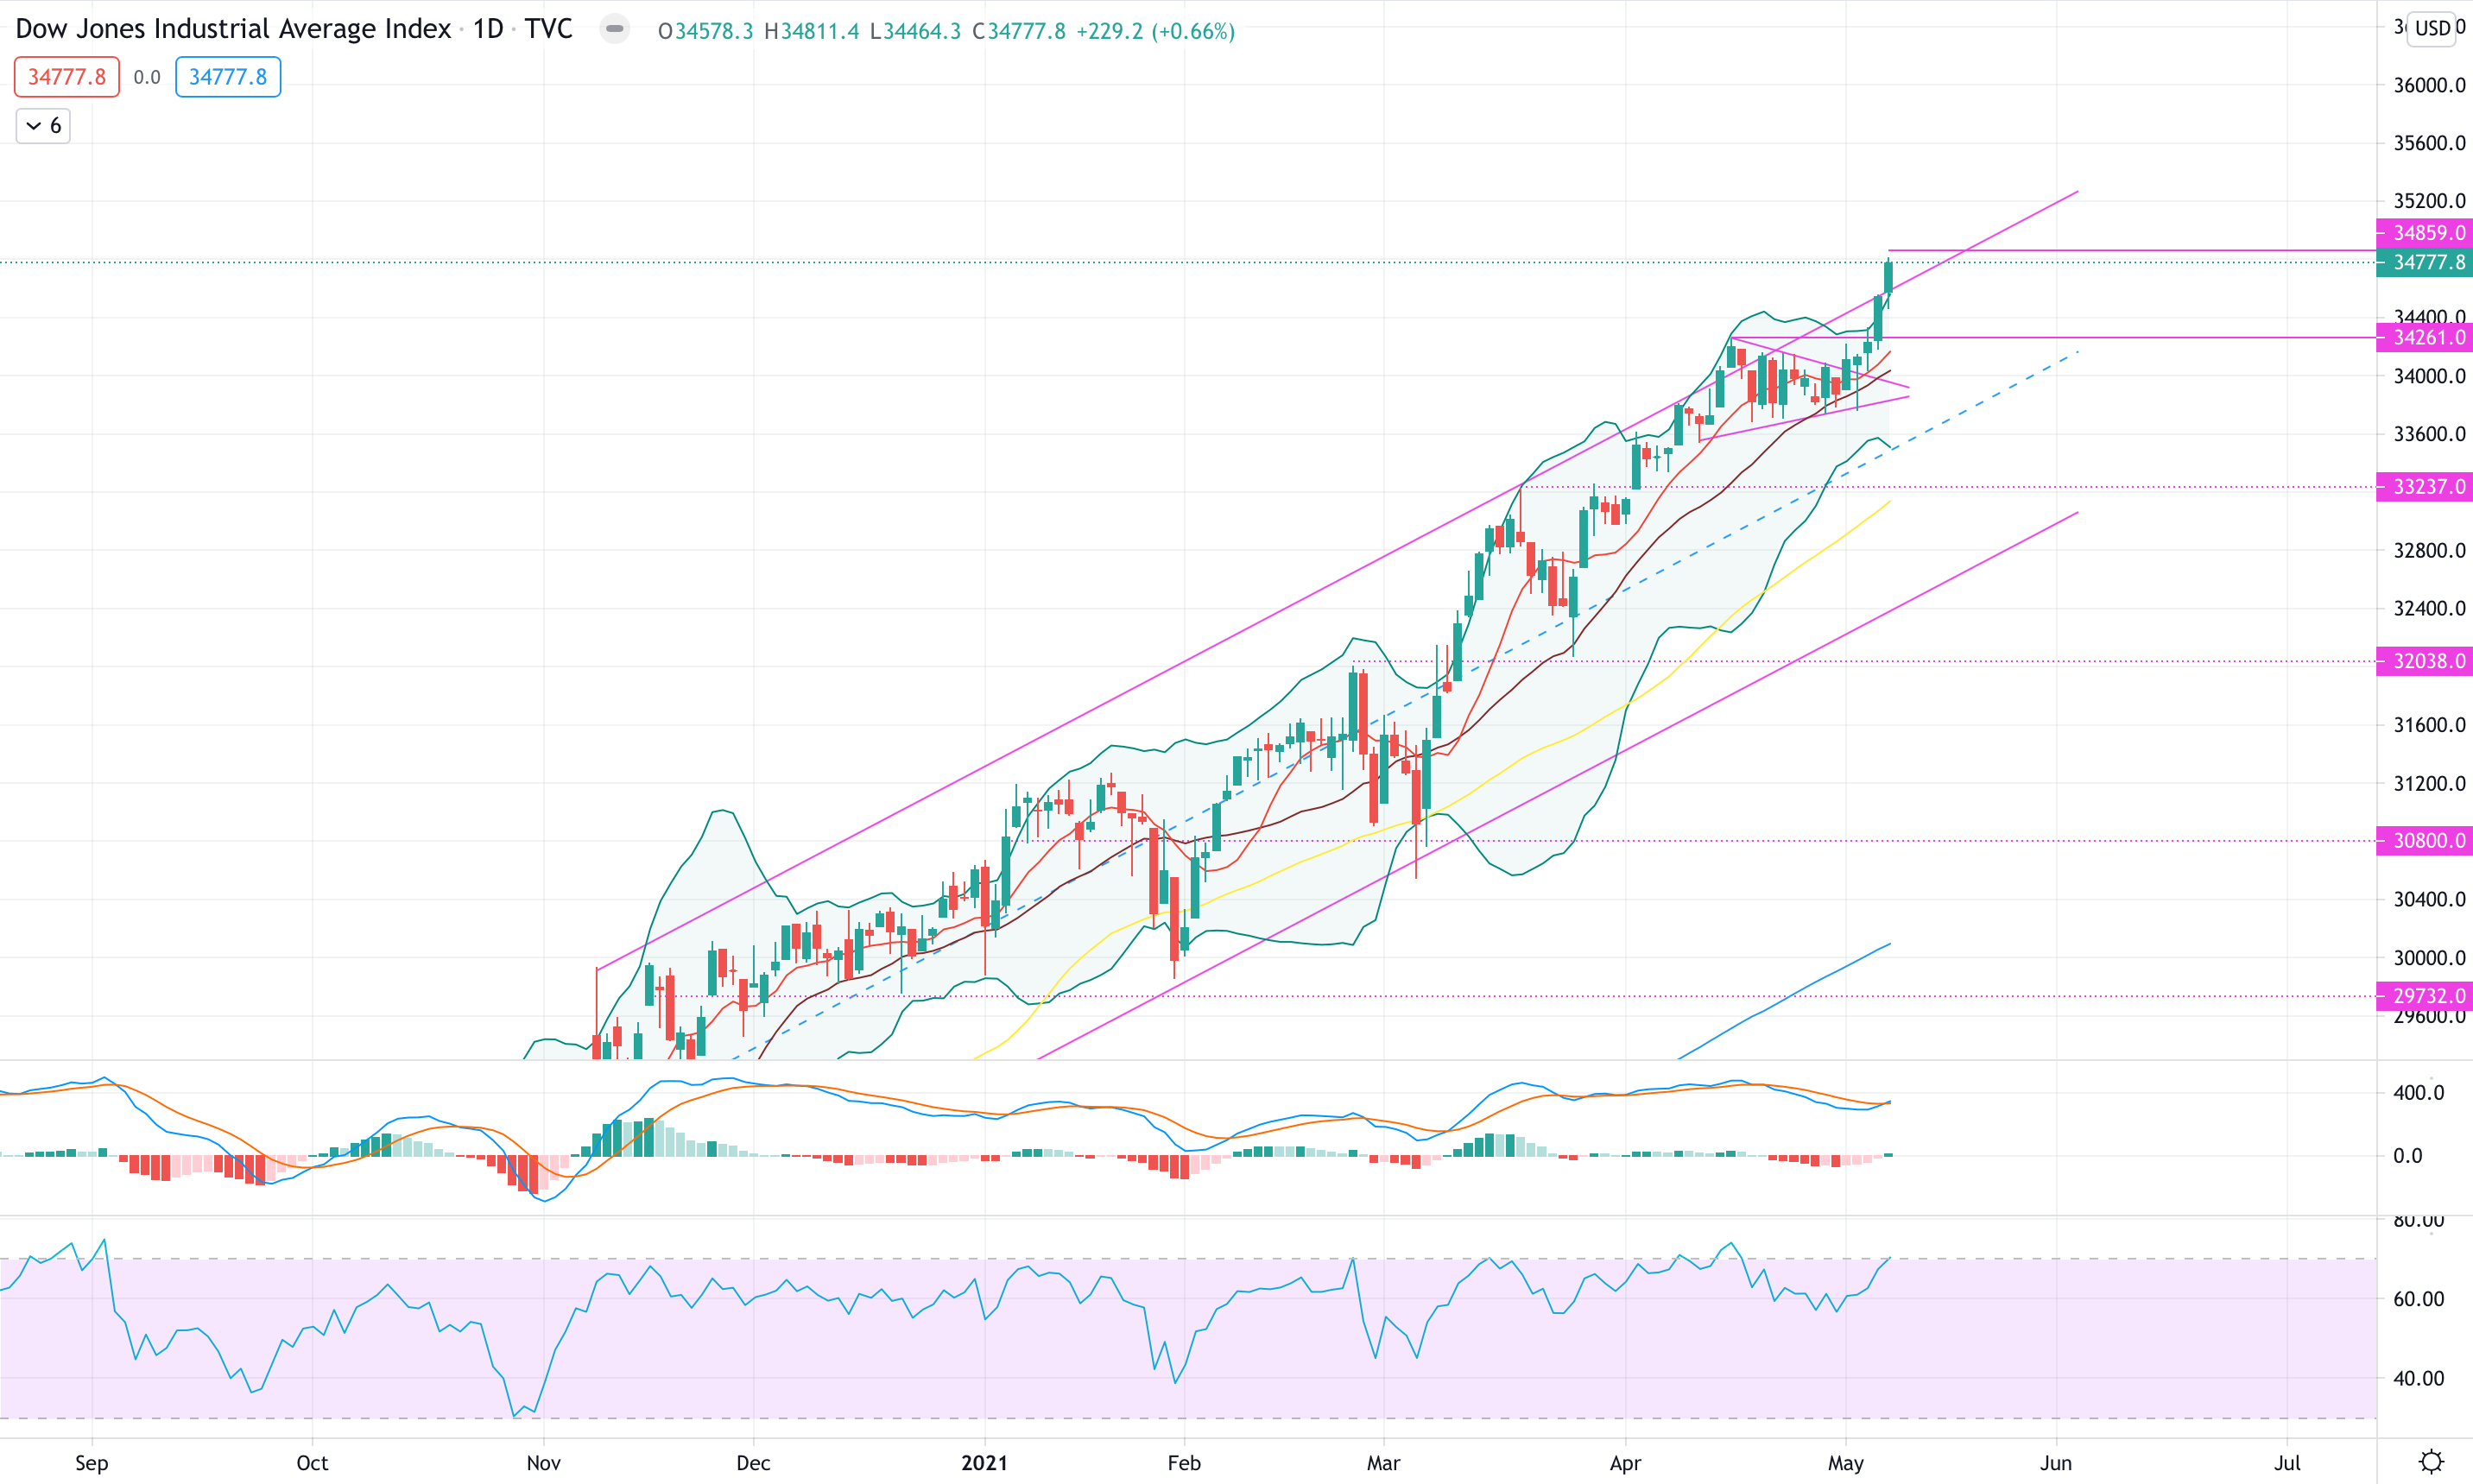
DOW JONES (#DJI)
The #DJI had a positive week up +1.93% and it is now at another record high.
From a technical perspective, it managed to break current resistance as well as the upper end of the channel. A bullish scenario, could now see the upper end of the channel as support however we are more in favour of a test of previous levels.
Looking at the indicator, the MACD is crossing over however it doesn’t show the strong breath we would expect at all time high. In addition, the RSI is showing divergence with the price.
For the week ahead, we are in favour of a test of support level before considering further moves.
Support at 34,261 and resistance at 34,859.
Author

Francesco Bergamini
OTB Global Investments
Francesco, BSc Finance and Msc in Business Management, graduated with Merit, is a professional with experience in the financial services industry and a keen interest in the financial markets.


