Market Overview
After a day that will go down in the record books as a “Black Monday” the dust is still settling. After hitting 1000 pints down on the day for the Dow Jones Industrial Average, the volatility has been enormous. The VIX index jumped over 50% on the day at one stage which was according to some source the largest ever one day move. It was interesting that the market rallied on Wall Street yesterday on the news of an email that Apple CEO Tim Cook sent to Jim Cramer of CNBC stating that Apple’s sales in China were fine. My mind harks back to the infamous email that the then CEO of Citigroup, Vikram Pandit sent on the day that the market bottomed in March 2009. Perhaps it is a bit early to be making such comparisons though.
The volatility has continued in Asia overnight with Chinese equities again under big selling pressure and on another session of big swings, the Nikkei closed 4% lower. As yet there is still no action from the People’s Bank of China which many see as necessary to calm the selling nerves of investors. The European markets have opened with a decent bounce, but it is likely that today will be another session of elevated volatility as traders and investors try to make sense of everything. The yield on the 10 year Treasury which hit almost 1.90% yesterday has bounced back above 2% again today and is so far looking relatively stable and this should help to calm the nerves of equity traders if this continues.
Forex markets have been just as volatile as equities have and once more the markets are trying to settle down again this morning. The euro and yen are unwinding some of their sharp gains from yesterday, whilst the commodity currencies are also managing to unwind some of yesterday’s losses. The gold price remains under a little pressure (as it did yesterday) and is off again.
Traders will have a bit of data also today to help distract them from China. The German Ifo Business Climate at 0900BST is expected to dip slightly to 107.7 (from 108.0). Then into the afternoon, US Consumer Confidence is at 1500BST and is expected to recovery from last month’s disappointment of a decline to 90.9 with a recovery to 93.4. Housing data is also on the agenda, firstly with the Case Shiller at 1400BST which is expected to improve to 5.1%, and then the New Home Sales at 1500BST which is expected to show an improvement from 0.48m to 0.51m.
Chart of the Day – DAX Xetra
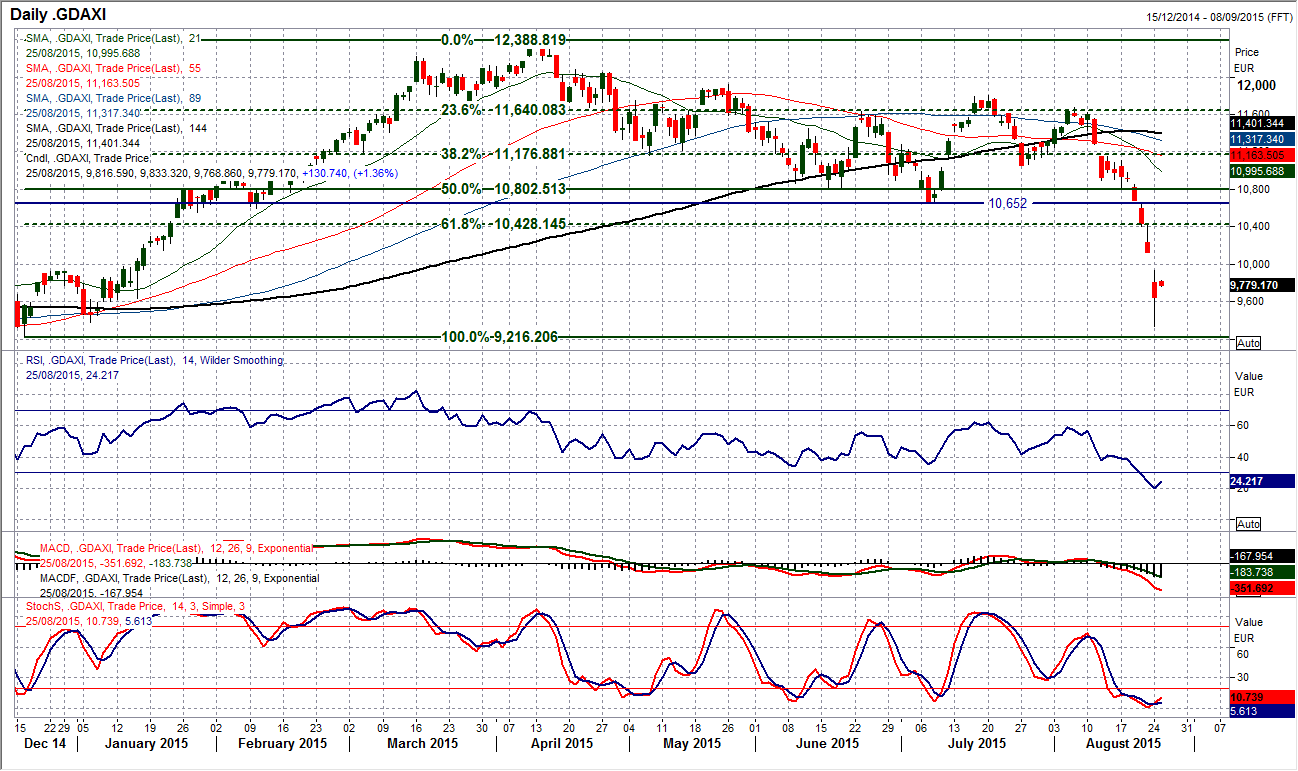
Well, pick the bones out of that one then! An absolute mauling for the DAX yesterday saw the market wipe all of its gains for the year away at the low of 9338. I have a feeling that a near term low may have been hit but that is not to say that it will not be retested again in the coming days/weeks. There was a sense of exhaustion selling, with the biggest spike in volume since March 2013. Not only that, the entire band (and it was a wide trading band at almost 600 points) was outside the Bollinger Bands. The RSI at 19 is the lowest since October 2014 and there is a definite look to the chart that the accelerated nature of the decline in recent days has reached a nadir. The market has opened strongly today and this is going to be a case of the volatility continuing. The first point of reference for a rebound is 9935 which was yesterday’s traded high (on my Reuters chart), then 10,000 which has been a historic level and then Friday’s closing low at 10,124 which is also a gap resistance too. There is plenty of scope for a rebound but there are also likely to be choppy waters ahead, so trading DAX is not for the faint hearted in the coming days. The gap open today has left initial support at 9787 and 9623.
EUR/USD
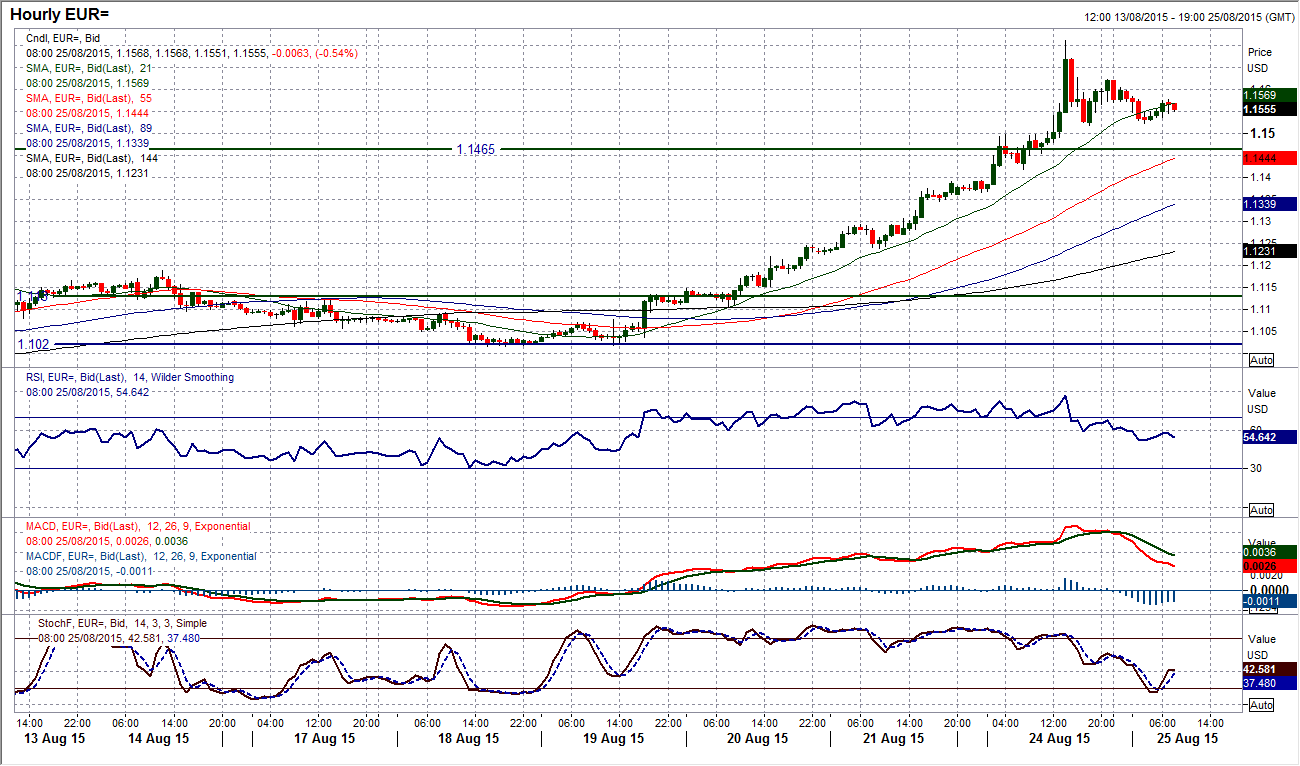
What an incredible day it was on forex markets yesterday, and the euro rebound was right at the forefront. From the low to the high of the day a 350 pip range was seen as the euro burst through the old key resistance at $1.1465. This was clearly an extremely strong move for the euro and I may be a bit early to say it but I feel that this all had the feel of a bit of an exhaustion move to it. The RSI is up over 70 and the move since that high at $1.1711 has already unwound almost 190 pips and I believe there could be more of an unwind to go. The old $1.1465 is now supportive and I would not be surprised to see the pair trading around there soon. The intraday hourly chart is already playing out a massive unwinding on the MACD lines and there was a bearish divergence on the hourly Stochastics. There is initial support at $1.1518 which if broken would start a sequence of lower high. Initial resistance comes in at $1.1622. Time for a correction maybe?
GBP/USD
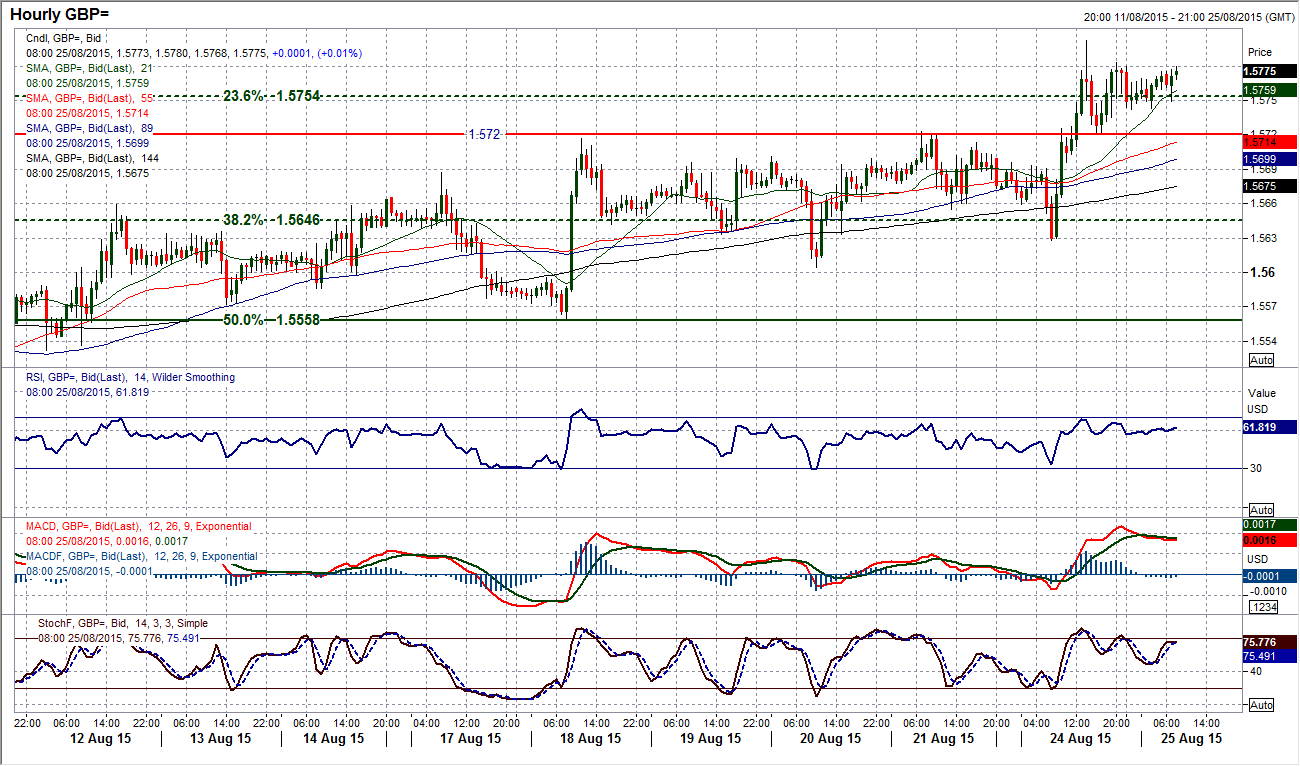
I have been complaining that the move higher on Cable was slow and rather painful, and even though I am prepared to back the sterling bulls I do not get a wholly convincing feeling to the chart. Once again watching the chart through yesterday’s session there was a real sense that it was being dragged higher almost kicking and screaming. However, the reality is that Cable has broken clear of the resistance at $1.5690. The RSI is now into the 60s and again I have to go with this move, albeit reluctantly. The intraday level above $1.5787 suggests that a test of the big high at $1.5928 is possible. The intraday hourly is again for me unconvincing though, with the hourly RSI still unable to push above 70 with yesterday’s move and the hourly Stochastics also unconvincing. I would now watch the support at $1.5720 as a move below here could induce a correction. The resistance initially is now at $1.5800.
USD/JPY
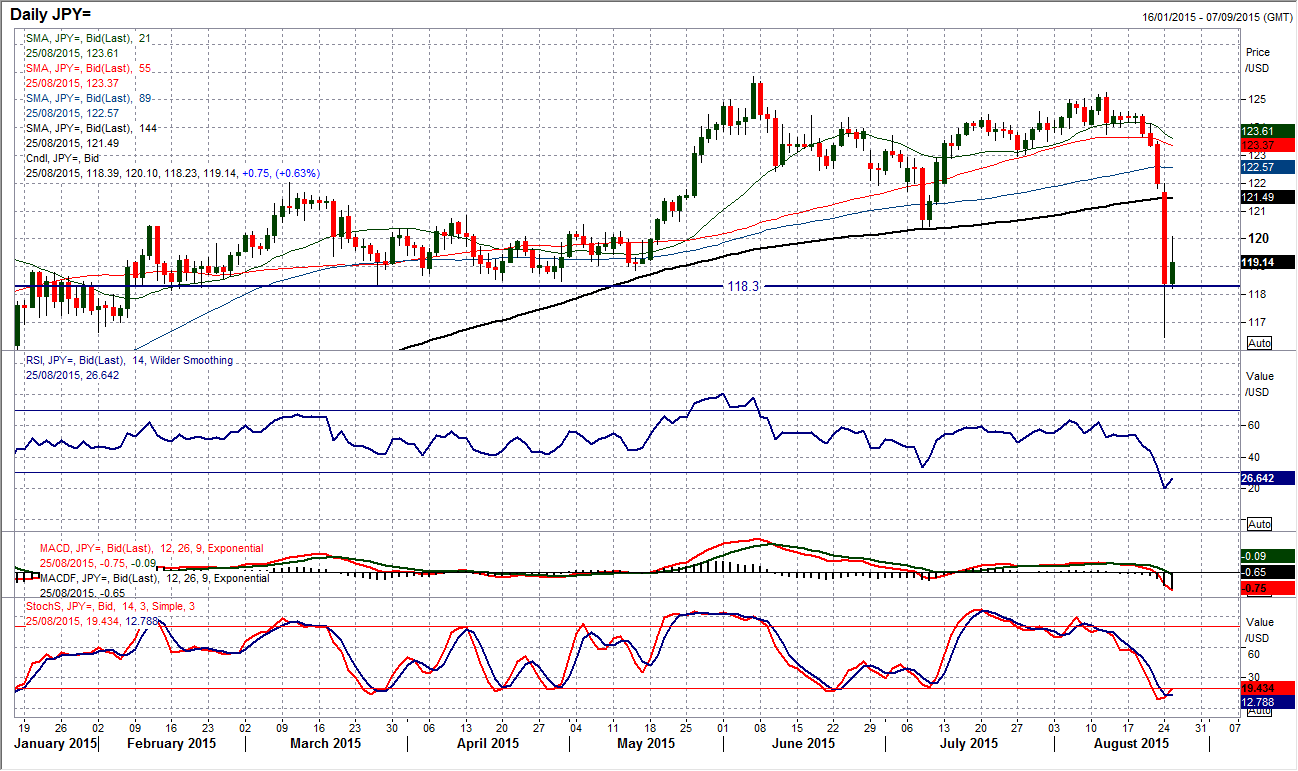
The volatility is still looking to settle down again after a mammoth daily range of over 550 pips. Since the nadir of yesterday’s spike lower at 116.46, the rebound has so far hit 120.10 (so over 350 pips off the low) and I do not believe that this is the end of the sharp moves. The RSI is still well below 30 and there has been a bull crossover on the Stochastics (not yet confirmed). The hourly chart shows momentum is now unwinding, whilst it is interesting that the was an element of support formed around the old key level at 118.30 into the close yesterday. This could certainly now be used as a basis of support today. The safest option wold be to wait for the market to settle, however, I still see scope for further unwinding on Dollar/Yen and I expect further pressure on the 120 level once more. Moving back below 118.30 in a settling market would be a disappointment for a recovery.
Gold
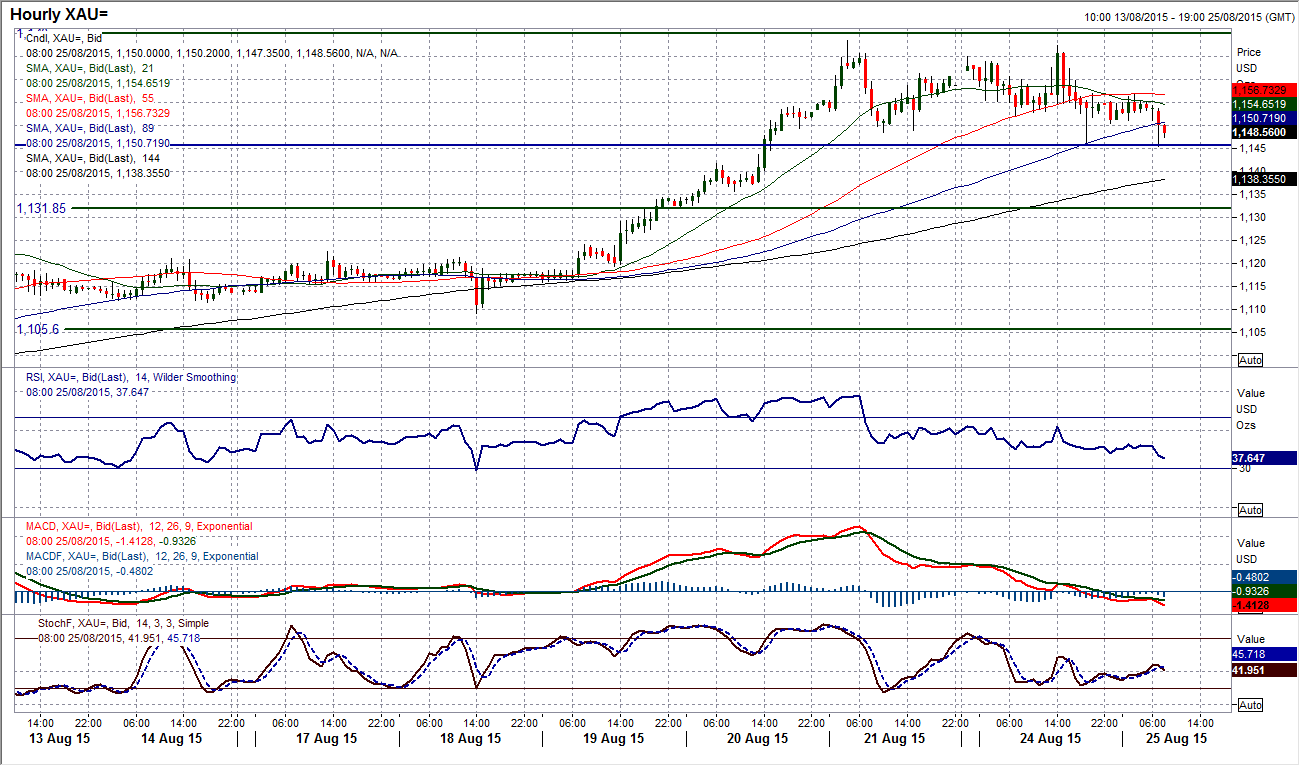
I talked about it yesterday afternoon, but I believe that the gold bugs would have been extremely disappointed looking at their screens yesterday as all the safe haven plays shot higher, but gold barely budged. This also despite the dollar sell-off. Instead we saw gold consolidating and ultimately close lower on the day to leave a rather worrying looking candle for the bulls. The intraday dip below support at $1148.50 was not a confirmed break but will keep the pressure on the support today. For now the daily momentum indicators remain decent, but the intraday levels have lost some of the impetus. The concern for me is that if gold was not going to continue the rally on a day like yesterday, then it will do well to prevent the profit takers in the coming days. The resistance remains in place at $1168.40. A confirmed move back below $1148.50 would constitute a near term breakdown and open for a retreat back towards the old key floor around $1132.
WTI Oil
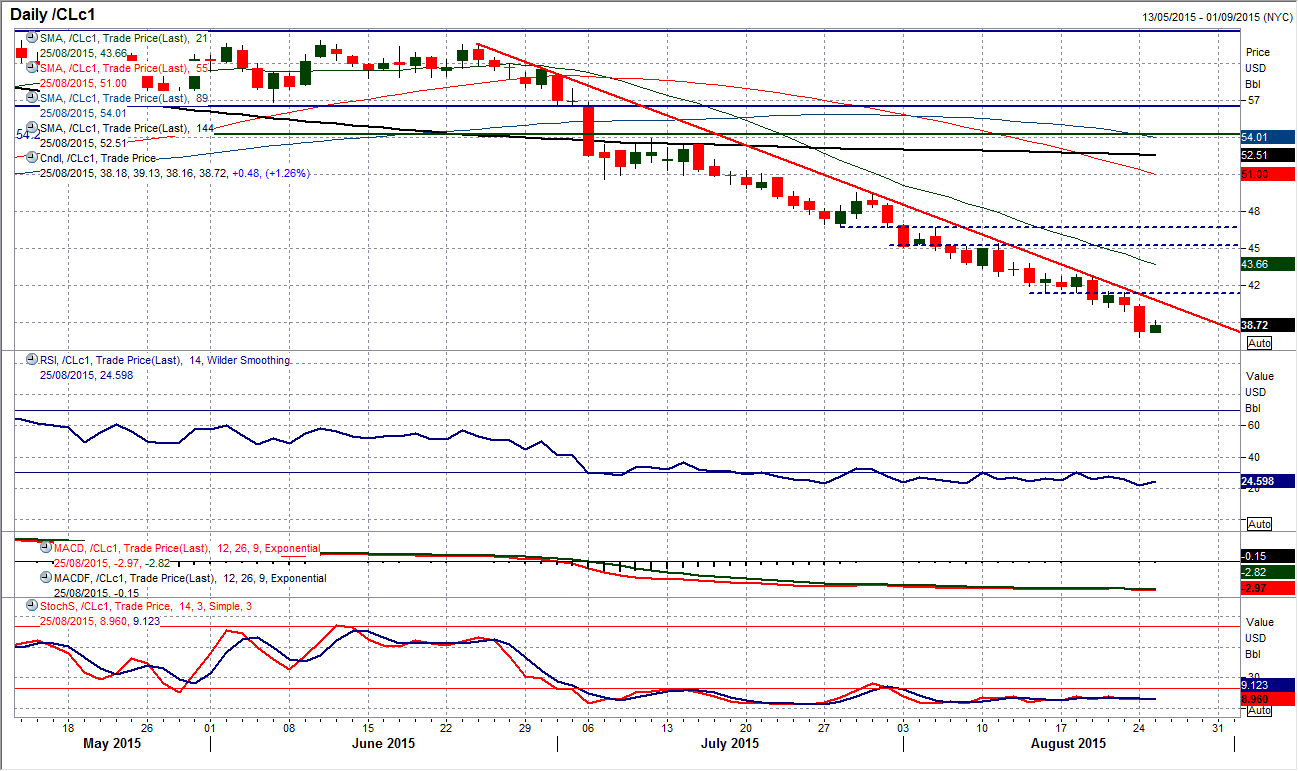
I was hoping that I would be analysing the WTI chart and somehow I would be able to articulate a view that would suggest an impending rally was just around the corner. I am sorry to say that I cannot see one yet. Despite a decline of over 5% at the lows yesterday, there is still very little to suggest the selling pressure has reached a climax. The downtrend is well formed and orderly, as it hugs the lower Bollinger Band and indicators such as the Parabolic SARs continue to track steadily lower. The RSI is back into the low 20s once more which may induce a very near term consolidation (perhaps hence the minor rally into the close), however the downtrend resistance comes in at $40.80 today and there would need to be a sizeable rebound to even register as a potential recovery. The intraday hourly chart shows initial resistance band still $40.00/$40.50.
Note: All information on this page is subject to change. The use of this website constitutes acceptance of our user agreement. Please read our privacy policy and legal disclaimer. Opinions expressed at FXstreet.com are those of the individual authors and do not necessarily represent the opinion of FXstreet.com or its management. Risk Disclosure: Trading foreign exchange on margin carries a high level of risk, and may not be suitable for all investors. The high degree of leverage can work against you as well as for you. Before deciding to invest in foreign exchange you should carefully consider your investment objectives, level of experience, and risk appetite. The possibility exists that you could sustain a loss of some or all of your initial investment and therefore you should not invest money that you cannot afford to lose. You should be aware of all the risks associated with foreign exchange trading, and seek advice from an independent financial advisor if you have any doubts.
Recommended Content
Editors’ Picks
EUR/USD clings to small gains above 1.0700 ahead of data

EUR/USD trades marginally higher on the day above 1.0700 on Tuesday after EU inflation data for April came in slightly stronger than expected. Market focus shifts to mid-tier US data ahead of the Fed's policy announcements on Wednesday.
GBP/USD recovers to 1.2550 despite US Dollar strength

GBP/USD is recovering losses to trade near 1.2550 in the European session on Tuesday. The pair rebounds despite a cautious risk tone and broad US Dollar strength. Investors await macroeconomic data releases from the US.
Gold extends daily slide toward $2,310 ahead of US data

Gold stays under bearish pressure and declines toward $2,310 on Tuesday. The benchmark 10-year US Treasury bond yield holds steady at around 4.6% ahead of US data, making it difficult for XAU/USD to stage a rebound.
XRP hovers above $0.51 as Ripple motion to strike new expert materials receives SEC response

Ripple (XRP) trades broadly sideways on Tuesday after closing above $0.51 on Monday as the payment firm’s legal battle against the US Securities and Exchange Commission (SEC) persists.
Mixed earnings for Europe as battle against inflation in UK takes step forward

Corporate updates are dominating this morning after HSBC’s earnings report contained the surprise news that its CEO is stepping down after 5 years in the job. However, HSBC’s share price is rising this morning and is higher by nearly 2%.
