Market Overview
With the Greeks (and other Eurozone parliaments) backing the bailout deal, today it falls upon the Bundestag in Germany to accept the deal. It seems as though the pieces are now falling into place as €7bn of bridge financing has been agreed to allow Greece to repay €3.5bn to the ECB on Monday, whilst the ECB has also raised the ELA ceiling by €900m (to €89.9bn) for the next week. This means that Greek banks will be able to open on Monday although the capital controls will remain in place for the next two weeks. Sentiment around the German parliamentary vote is cautious with European equities mixed in early trading. This comes despite a positive close on Wall Street (S&P 500 up 0.8%) and Asian markets also stronger.
In forex trading there is a mixed outlook today with a slightly weaker dollar feel. Sterling is a stronger performer in early trading, after Bank of England Governor Mark Carney gave a strong hint that a possible rate hike would come into sharp focus around the end of the year. Markets have previously been pricing in a first rate hike around the middle of 2016.
With very little European data on the calendar, traders will be looking towards a batch of US data this afternoon. The most important is US CPI at 1330BST which is expected to just dip slightly month on month to +0.3% from +0.4%. Also this afternoon there are the building permits (1.11m exp) and housing starts (1.10m exp) also at 1330BST. The preliminary reading of the US Michigan Consumer Sentiment is at 1500BST and is expected to stay around the levels of last month at 96.0.
Chart of the Day – DAX Xetra
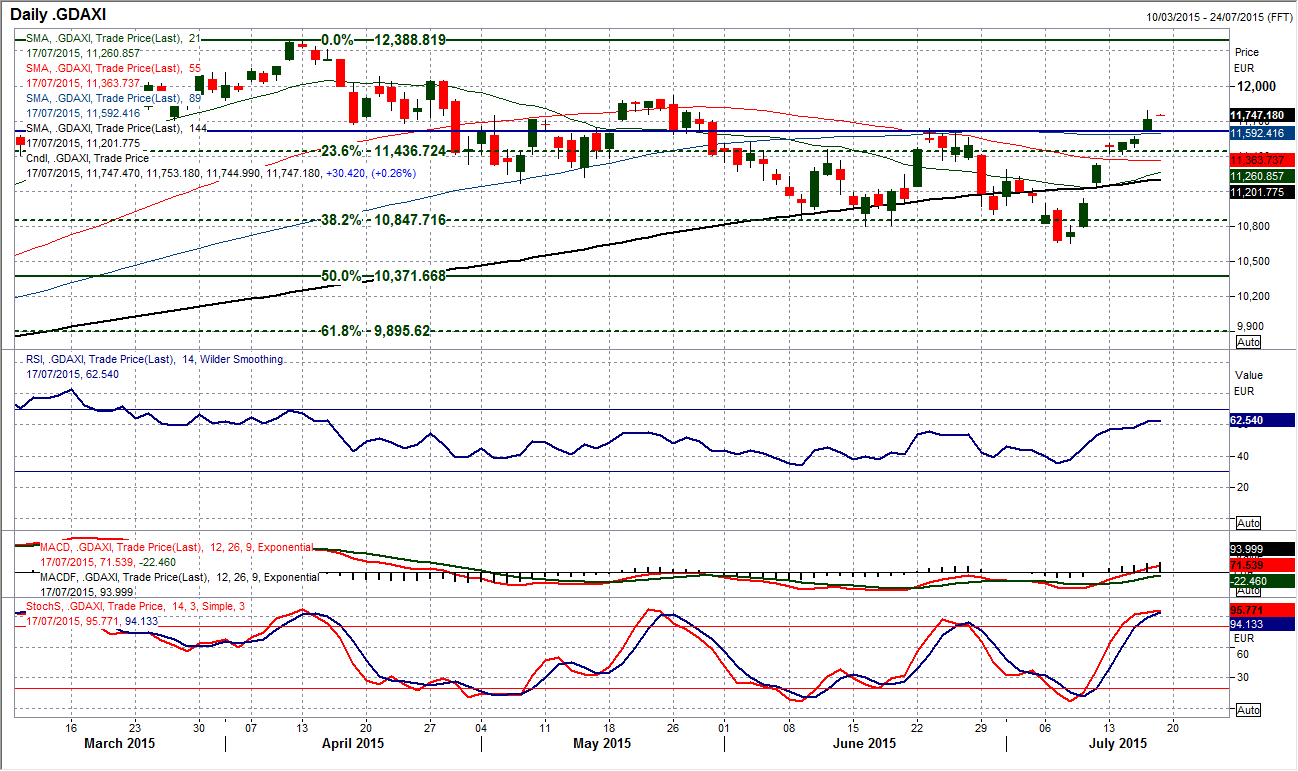
What a rally on the DAX! Since the multi-month low on 8th July at 10,653 the DAX has surged 10% in 7 sessions to completely turnaround the technical outlook. The breakout above the June high of 11,635 yesterday has broken a sequence of key lower highs and looks to have finally broken the shackles of this correction. The next hurdle is the 11,920 May high as the market now trades clearly above all the moving averages for the first time since April. The RSI pushing above 60 is confirmation that the bulls are in control now. There are gaps all over the place on the intraday chart, with an opening gap higher in on three occasions in the past week, none of which have been filled. This is fairly common with the DAX and subsequently I do not read much into this. Once the market starts to settle down it will be interesting to see how the market accepts this push above resistance and would be my main concern from backing a continued bull run. The temptation to take profits may set in. There is now support at 11,620 (which is an old pivot level) and 11,414. Watch for the uptrend on the hourly chart being tested and possibly the rising 21 day moving average (c. 11,610) which has become a basis of support.
EUR/USD
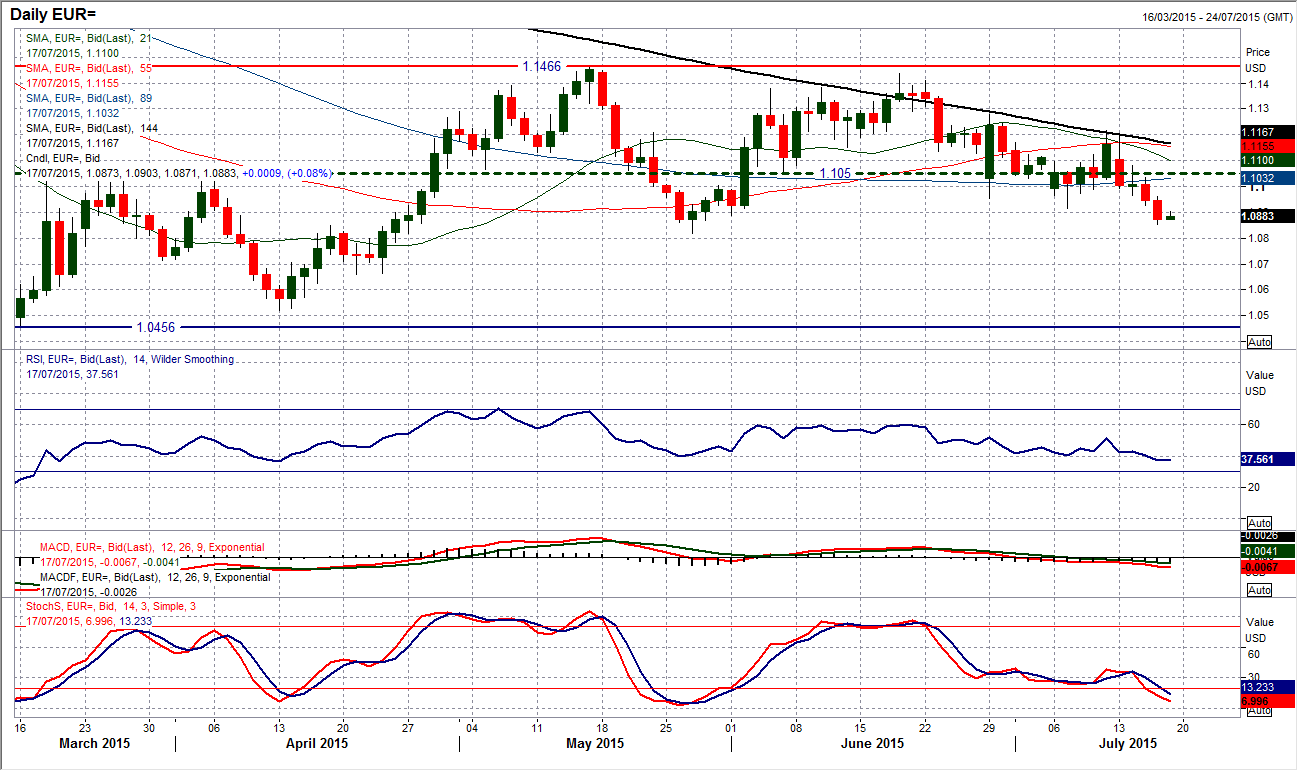
I was interesting that despite Mario Draghi painting a fairly upbeat assessment of an improving Eurozone and the ECB also extending the ELA, that the Euro remained under pressure. EUR/USD has continued to fall away as it has throughout this week, to close at $1.0874 which was well below the previous support at $1.0915. The technical outlook continues to deteriorate, with the daily Stochastics now in negative configuration and the RSI falling away to a 7 week low. This all points towards further downside pressure back towards the key May low at $1.818. There is a downtrend on the hourly chart which has been tracking the run lower this week which the euro is now testing. However I see this as more of a rally being a chance to sell, with the hourly RSI just unwinding once more back towards 50 around which the rallies have tended to fall over in the past week. There is initial resistance in the band $1.0925/$1.0960 and any sell signal in this range would be another opportunity.
GBP/USD
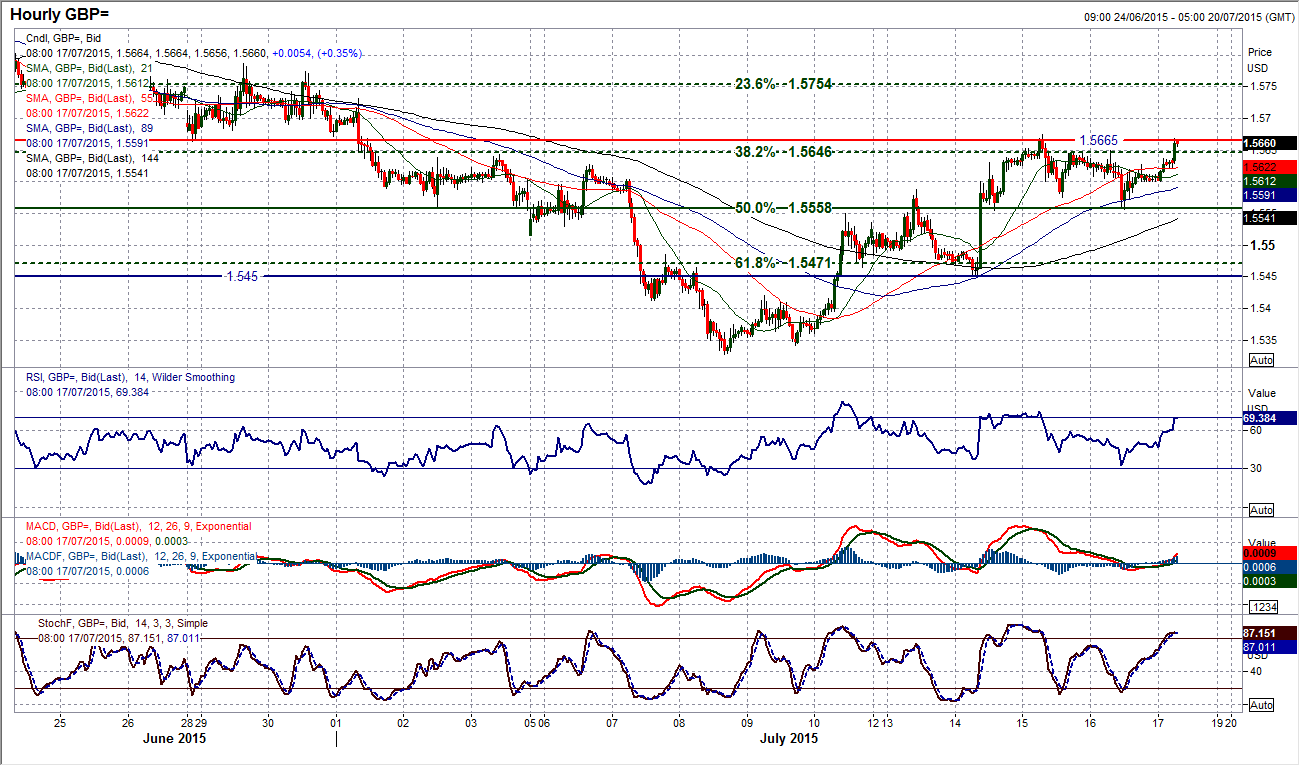
I spoke yesterday about the run higher just stalling a touch, but I am still happy to back a near term bull run. Although momentum indicators are not as strong as they were earlier in the week, I still see positive Stocashtics and the MACD lines have bottomed. However, the overhead resistance becomes apparent when you look at the hourly chart with the 38.2% Fibonacci retracement level of $1.5188/$1.5928 coming in at $1.5646 and proving to be a barrier in the past couple of days. Fibonacci retracements can act as areas of consolidation and this is what we are seeing now, whilst there is also the resistance from the old support around $1.5670 also preventing the bulls from running higher near term. It is interesting that I spoke of the consolidation between the 38.2% and 50% Fib levels yesterday, and subsequently Cable formed support at the 50% Fib level (at $1.5558) almost to the pip. So this is merely a consolidation for now, which the near term technicals suggest is likely to be resolved to the upside. Above $1.5670 opens $1.5730 resistance.
USD/JPY
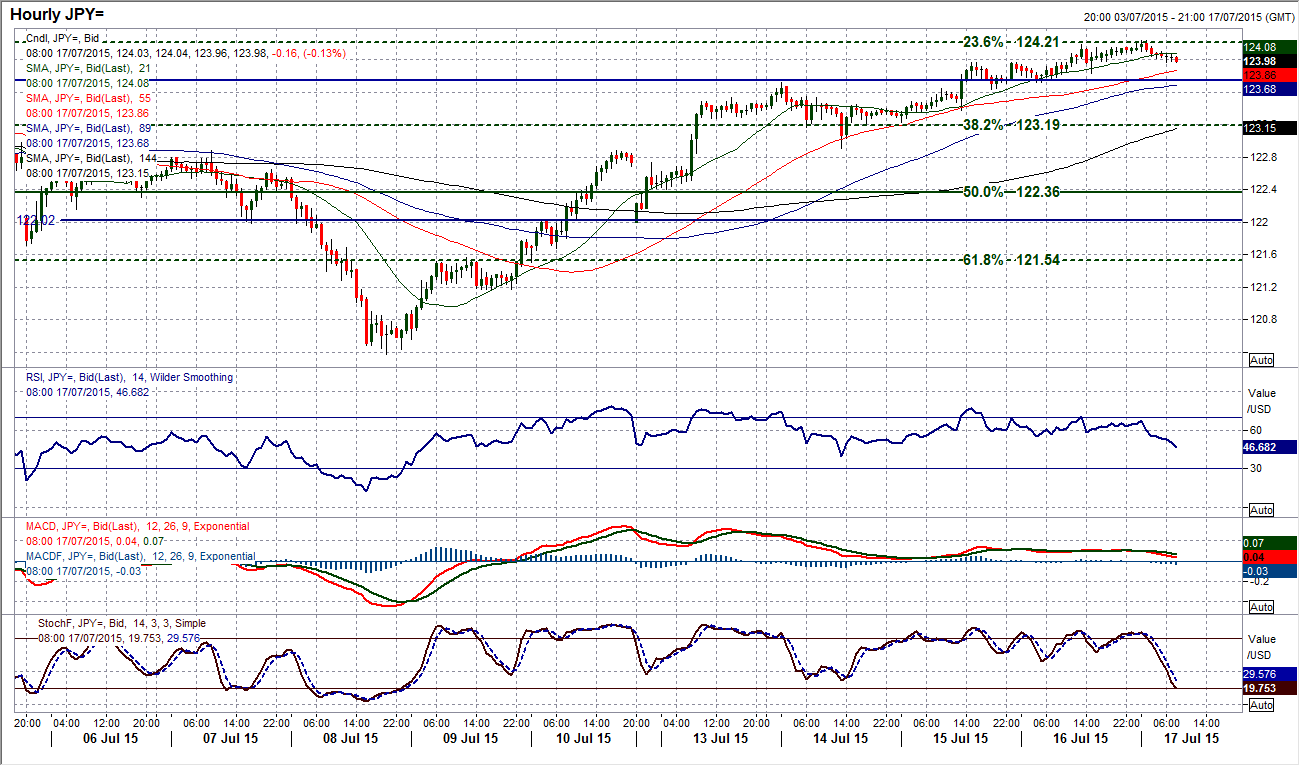
The run higher is now into an important stage as there is a series of key resistance levels that are now under pressure. The 23.6% Fibonacci retracement at 124.20 and the key late June highs of 124.43 are now being tested. To add to the importance, the daily RSI is up to the level at which it fell over back in late June. If a move on the RSI goes above 60 then I believe this would be an indication of the bulls gathering momentum for a push on the multi-year high at 125.85. The rebound has been impressive but looking at the intraday hourly chart, it becomes clear that the bulls have a real fight on their hands. The slight pullback in the Asian session is posing a few questions. The hourly RSI has just dipped to a 3 day low, the hourly MACD is solid if unspectacular. I would watch the rising 55 hour moving average (c. 123.85) which has supported the corrections in the past few days, a breach may be a sign that the bulls have run out of steam. A breach of the support at 123.60 would confirm the bulls have lost control.
Gold
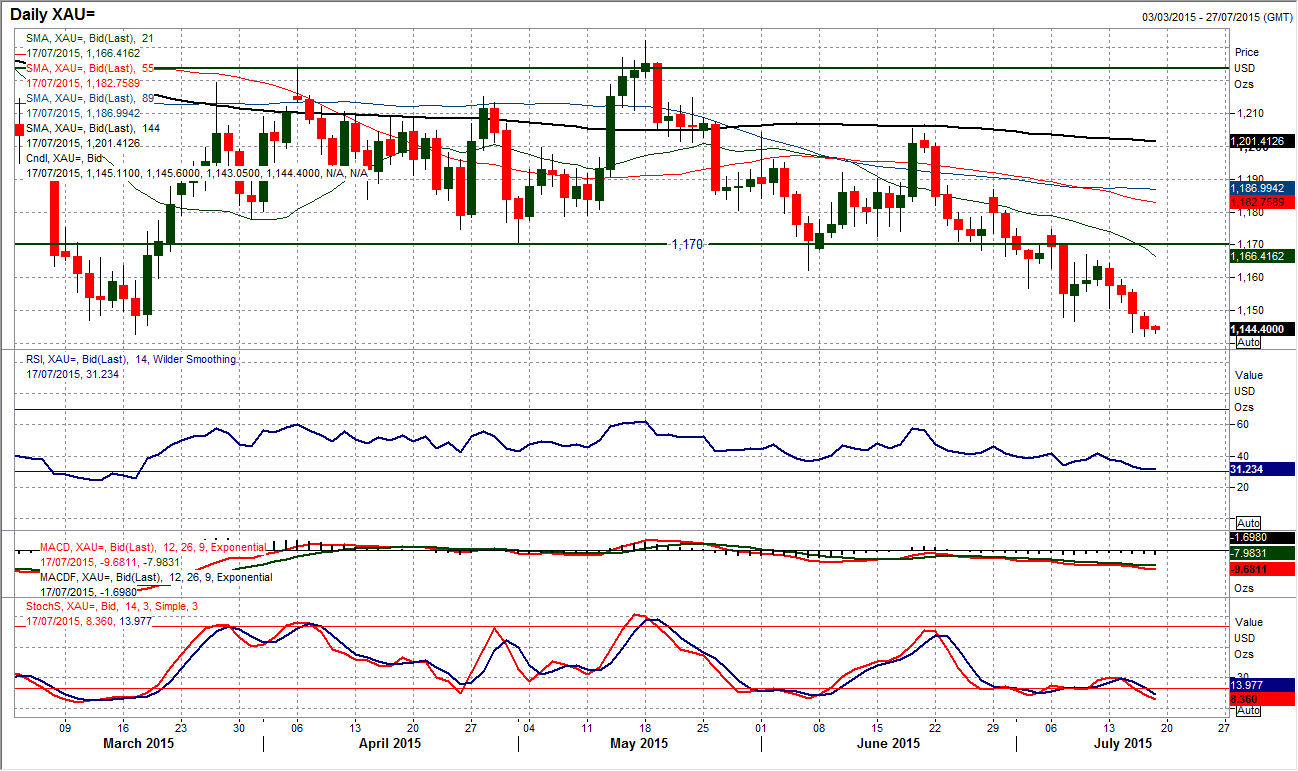
Once more the gold price continues to fall away and is now directly testing the key March low support at $1142.85 (even briefly moving to a new multi month low at $1142.10 before a rebound yesterday). The outlook remains bearish with momentum indicators negatively configured across the board and any intraday rallies continuing to be sold into. The hourly chart shows a consistent indication of downside pressure and bearish hourly technical indicators. Although we should wait for a confirmation of a downside break of the support, the suggestion is that this level will come under serious test and is likely to be breached which would open the critical November low at $1131.85. The hourly chart shows that the RSI is now unwinding towards 50/60 to give another chance to sell. The near term resistance comes in at $1149.75 before more considerable resistance around $1159.50. There is very little sign on either the daily or intraday charts of the bulls mounting a recovery with technicals suggesting rallies will be sold into.
WTI Oil
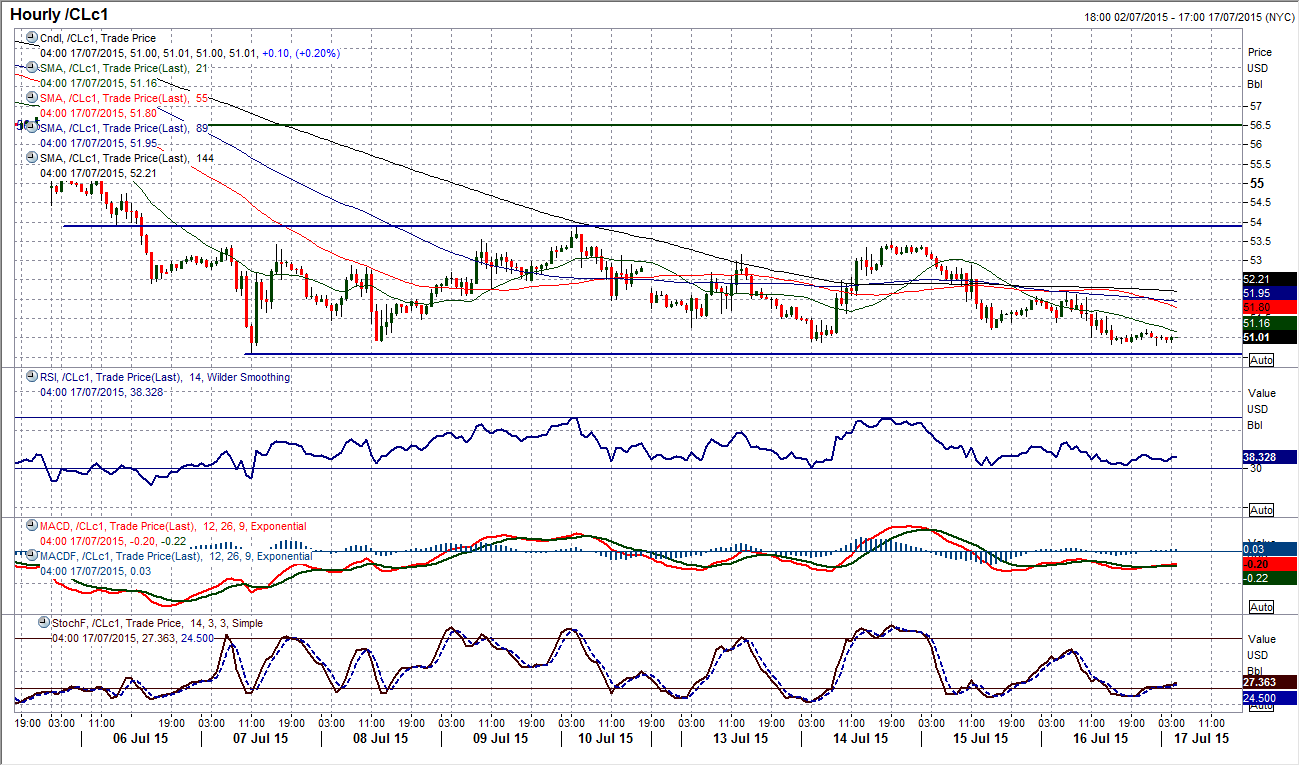
WTI is now into its 9th day of this tight consolidation between $50.38/$54.00. The interesting feature of the trading band is that several of the days in the range have seen both the highs and the lows tested. This suggests a real lack of conviction in what is a rather volatile range. However I continue to see this as a bearish consolidation with the daily chart showing a continual failure to break back above the neckline of the old base pattern at $54.24. Furthermore, the momentum indicators are in firmly negative configuration, with the RSI hovering around 30, and the Stochastics under 20 now throughout the range. I continue to expect a downside break and a move towards the $49.50 target that continues to be implied from a break below $56.50. The next support below the range does not come in until $47.05. I am looking to use rallies within the range as a selling opportunity, with a closing breach of the range opening the downside.
Note: All information on this page is subject to change. The use of this website constitutes acceptance of our user agreement. Please read our privacy policy and legal disclaimer. Opinions expressed at FXstreet.com are those of the individual authors and do not necessarily represent the opinion of FXstreet.com or its management. Risk Disclosure: Trading foreign exchange on margin carries a high level of risk, and may not be suitable for all investors. The high degree of leverage can work against you as well as for you. Before deciding to invest in foreign exchange you should carefully consider your investment objectives, level of experience, and risk appetite. The possibility exists that you could sustain a loss of some or all of your initial investment and therefore you should not invest money that you cannot afford to lose. You should be aware of all the risks associated with foreign exchange trading, and seek advice from an independent financial advisor if you have any doubts.
Recommended Content
Editors’ Picks
EUR/USD stays weak near 1.0700 ahead of key EU inflation, GDP data

EUR/USD is keeping the red near 1.0700, undermined by a broad US Dollar rebound and a mixed market mood early Tuesday. Germany's Retail Sales rebound fail to impress the Euro ahead of key Eurozone inflation and GDP data releases.
GBP/USD remains pressured toward 1.2500 on US Dollar rebound

GBP/USD is extending losses toward 1.2500 in European trading on Tuesday. A cautious risk tone and a decent US Dollar comeback weigh negatively on the pair. The focus now shifts to mid-tier US data amid a data-light UK docket.
Gold struggle with $2,330 extends, as focus shifts to Fed decision

Gold price is looking to build on to the previous downside early Tuesday, as traders continue to take profits off the table in the lead-up to the US Federal Reserve (Fed) interest rate decision due on Wednesday.
BNB price risks a 10% drop as Binance founder and ex-CEO Changpeng Zhao eyes Tuesday sentencing

Binance Coin price is dumping, with the one-day chart showing a defined downtrend. While the broader market continues to bleed, things could get worse for BNB price ahead of Binance executive Changpeng Zhao sentencing on Tuesday, April 30.
Data fuels China optimism

China's factory activity has expanded for a second consecutive month, marking the best streak in over a year and fueling optimism for the sustainability of the world's second-largest economy's recovery.
