Market Overview
Financial markets have been digesting the strong gains in the oil price in the past couple of days. The move has pushed WTI oil to its highest level of the year and begs a couple of questions. With a sharp fall in the inventory build it could be that either the reduction rig count is beginning to impact on supplies or could be a pick-up in demand. However the price has been supportive of Wall Street which has also been pleasantly surprised by a decent start to earnings season (on admittedly sharply reduced expectations).
This has driven the S&P 500 to back above 2100 and within touching distance of the resistance band 2115/2120 which would mark a breakout to a new all-time high again. Asian markets have been gain mixed overnight, with the Nikkei broadly flat, just up 0.1%, although Australian shares were boosted by the positive moves on oil and some stronger employment data. European markets are also mixed at the open, with sentiment dogged by a downgrade of Greece’s credit rating by Standard & Poor’s ratings agency to negative whilst German finance minister Schaeuble suggested difficulties over a potential solution over an agreement on emergency funding.
In forex trading, the dollar took more of a hit into the close yesterday after the release of the Fed’s Beige Book. The Fed’s assessment of the country’s economy was that growth was “slight” or “moderate” with manufacturing weak and retail sales mixed, whilst housing and real estate were positive. However the dollar is once more showing early signs of a fightback today, which seems to be a feature of recent days. Support for the dollar forming in the early European session only to be impacted negatively by the release of disappointing data. The Australian dollar is the big mover so far, up just under a percent in the wake of the positive employment data.
Traders will be focusing on the US once more today. Housing data has been a positive for the dollar in recent weeks, and today could be supportive again with the release of Building permits (1.08m expected) and housing starts (1.04m expected) both at 1330BST. Weekly jobless claims are expected to be broadly in line with last week at 280,000 at 1330BST. Also of note this afternoon at 1500BST is the Philly Fed data.
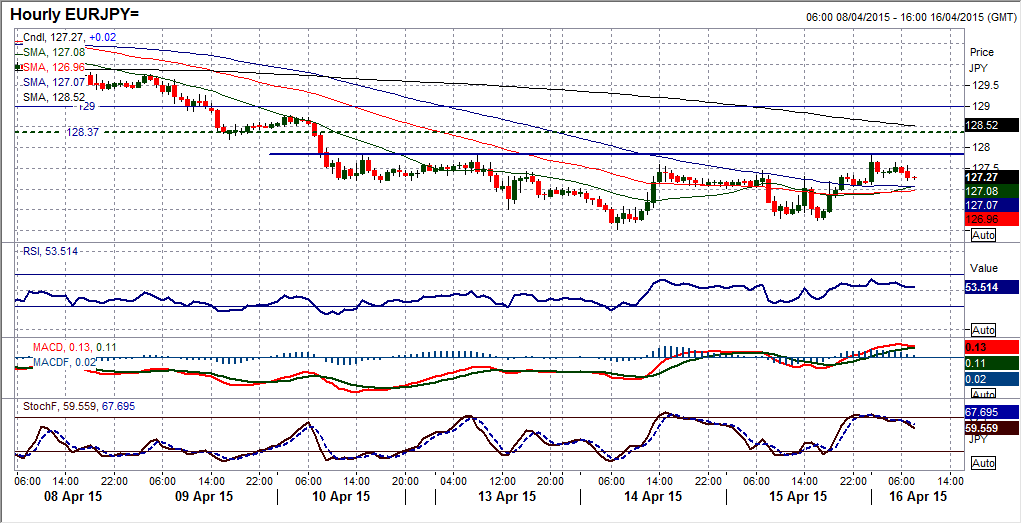
Chart of the Day – EUR/JPY
A very interesting wave of selling pressure seems to have come to an end, for now. The 5 consecutive bearish candles gradually accelerated downwards and then started to moderate the downside pressure, to then be replaced by some mildly positive candles. Another interesting development is that the support has once again come on the top-side of the old downtrend that dated back to December (always keep your old trend lines on your charts as they still have a role to play even when they have been broken). Momentum indicators have yet to make a decisive improvement, but are beginning to show some green shoots of recovery as the Stochastics have begun to turn up. The intraday hourly chart shows an interesting resistance is at 127.85, as a break above would confirm a small base pattern that would imply a move back towards 129.50. The hourly momentum indicators have certainly started to improve, with the hourly MACD and RSI both more positively configured. A rally is certainly threatening. The key support now comes in the range between 126.00/126.25. Initial support is at 127.00.
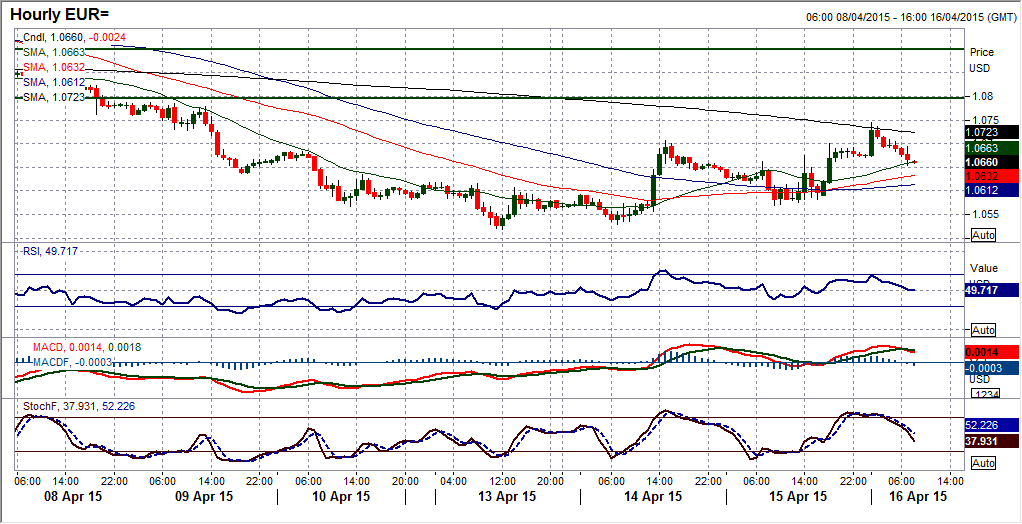
EUR/USD
After a very choppy session yesterday, the euro has continued to rebound. Closing towards the high of the day is giving the bulls some hope that some traction can be gained now. The momentum indicators have picked up slightly, with the Stochastics beginning to provide a bull crossover. However the Asian session has been mixed overnight as an breach of the resistance around $1.0710 has been swiftly reversed at $1.0746. The intraday chart shows that the outlook is beginning to improve and the set up in the hourly momentum indicators is more positive than it has been for several weeks. The push above $1.0710 was positive but a move above $1.0800 pivot level needs to be seen otherwise it will continue to be seen as a mere rally to be sold into. Progress has been made but more needs to be done. The support at $1.0640 needs to hold as does $1.0570.
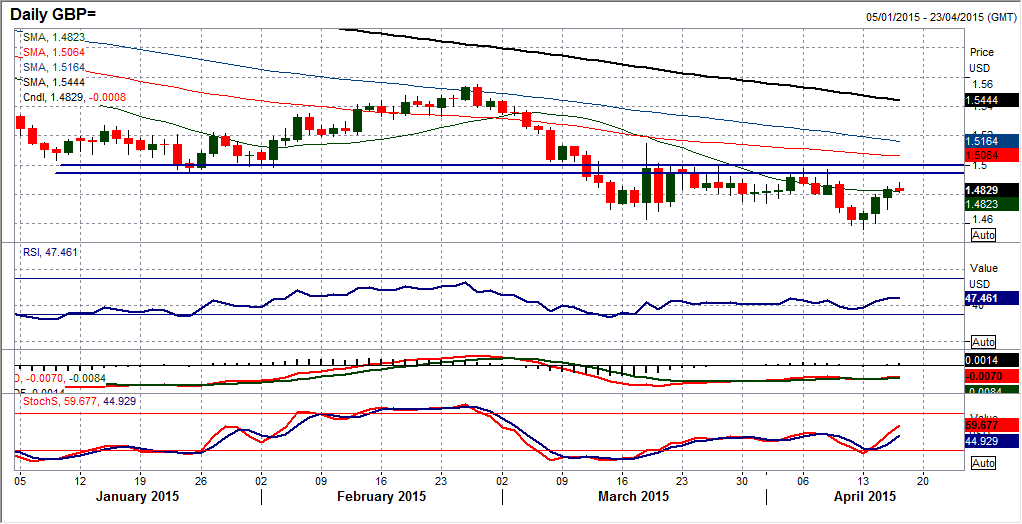
GBP/USD
A third strong candlestick in a row has got the bulls feeling more confident. However, as with the euro, there is still much that needs to be done. The key overhead resistance band at $1.5000 is looming and this is the major barrier to gains. Today could be important to the near term outlook too. The 21 day moving average has been a basis of resistance, currently at $1.4823 but has flattened off now. Also momentum indicators are trying to pick up, but are still in a configuration that suggests that rallies should be sold into. The RSI moving above 50 would improve the outlook. The intraday hourly chart shows a good improvement, but it is interesting that an old pivot level around $1.4860 from late March and early April has just put a cap on the gains for now. Initial support comes back at $1.4800, whilst 1 big figure below at $1.4700 is also supportive. I would be on the lookout for sell signals under $1.5000.
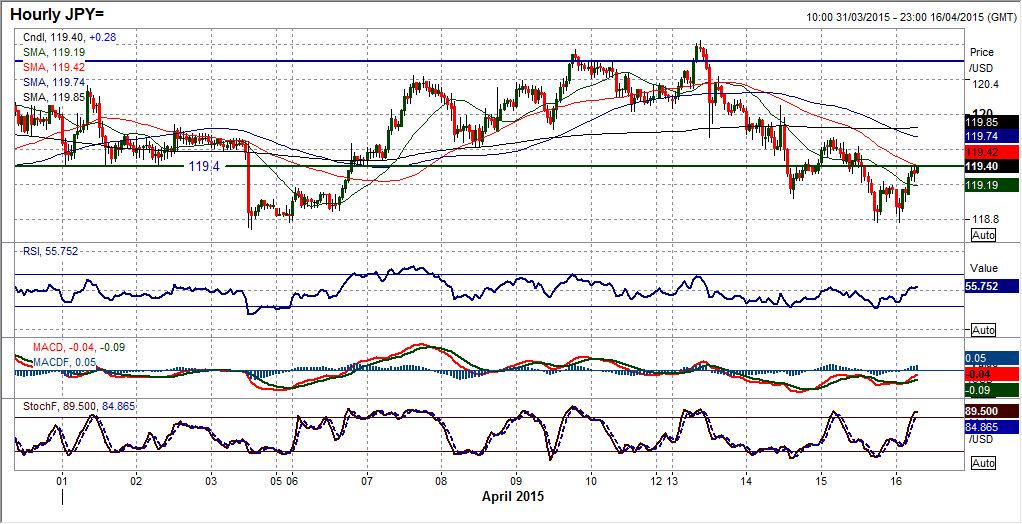
USD/JPY
If the neutral outlook is to continue on the daily chart then the bulls need to return in the next day or so. The dollar correction continued overnight but has started to reverse during the Asian trading session. The pick up off the support around 118.70 has now resulted in a bounce that is set to test the pivot around 119.40 once more. If the sequence of lower highs and lower lows is to continue then this pivot level could once more have a role to play. If this can be breached then a test of the reaction high at 119.75 will be seen. Hourly momentum indicators have taken on a more corrective outlook in the last couple of days and this suggests that the bulls have got some work to do to prevent a retest of 118.70 and the subsequent key support at 118.30.
Gold
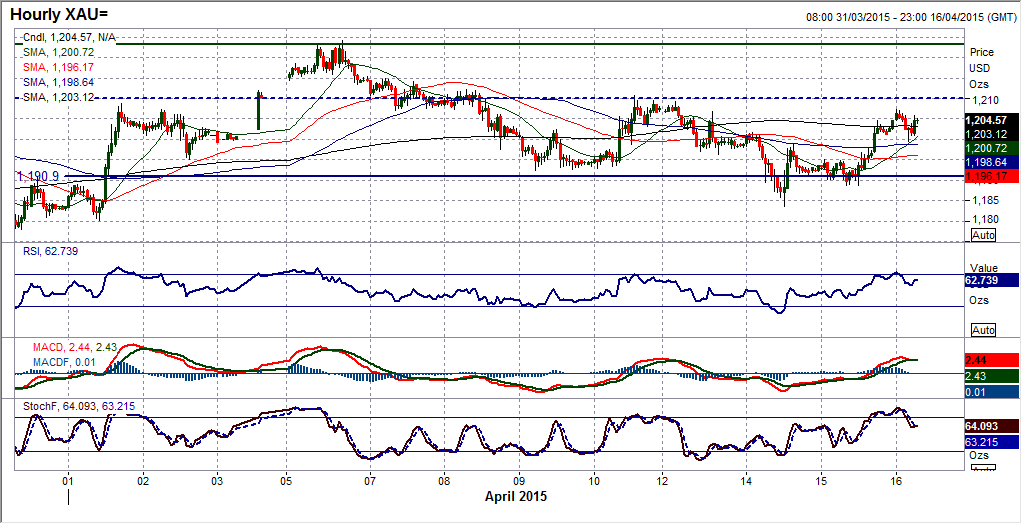
The ranging phase continues. Yesterday’s rebound has left a decently positive candle which has maintained the support at $1183.70 but also once more gone to neutralise an outlook that had been threatening to deteriorate. There is more work that needs to be done, with the Stochastics still a touch corrective, but broadly all the other indicators on my chart are neutral. The move above $1200 has settled a few psychological nerves, but the intraday hourly chart shows the overhead barrier is at $1210.70, which protects the key resistance around $1224.20. During periods such as this it is difficult to pick near term direction as the market has become so choppy. Perhaps we can start to look at the hourly momentum indicators for the classic buy and sell signals as it is a range play. So, by that regard, perhaps look towards potential short positions again, with the RSI towards 70, MACD lines ready to cross lower and Stochastics already having crossed. I see this range continuing as the raft of US data continues to flood through.
WTI Oil
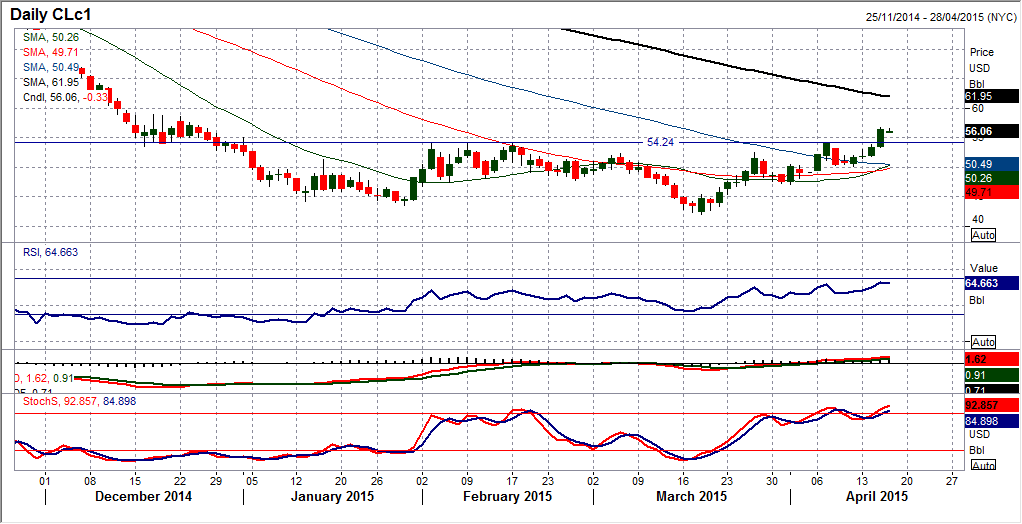
Yesterday we finally saw the price of WTI oil breaking above the key resistance of the 3rd February high at $54.24. The move came on the back of lower than expected US oil inventories, but has also meant a move to a new 2015 high on the price. This now arguably completes a three and a half month base pattern which implies a move upwards towards a minimum target of $65. However, we must proceed with a little caution and look for confirmation first before getting too bullish. For a breakout this important, a two day close above the neckline would certainly be the first factor to look for. Interestingly, the RSI has confirmed the move with a push to the highest since mid-June. Furthermore, the shorter moving averages are beginning to all turn higher in bullish sequence. The intraday chart suggests now the old resistance t $54.24 is the basis of support and a higher low around there would be a validation of the breakout. A bearish shooting star hourly candle could induce a near term correction but could also induce a move to give another chance to buy. The support band at $50 is now key support. Next resistance is at $59.00.
Note: All information on this page is subject to change. The use of this website constitutes acceptance of our user agreement. Please read our privacy policy and legal disclaimer. Opinions expressed at FXstreet.com are those of the individual authors and do not necessarily represent the opinion of FXstreet.com or its management. Risk Disclosure: Trading foreign exchange on margin carries a high level of risk, and may not be suitable for all investors. The high degree of leverage can work against you as well as for you. Before deciding to invest in foreign exchange you should carefully consider your investment objectives, level of experience, and risk appetite. The possibility exists that you could sustain a loss of some or all of your initial investment and therefore you should not invest money that you cannot afford to lose. You should be aware of all the risks associated with foreign exchange trading, and seek advice from an independent financial advisor if you have any doubts.
Recommended Content
Editors’ Picks
EUR/USD clings to small gains above 1.0700 ahead of data

EUR/USD trades marginally higher on the day above 1.0700 on Tuesday after EU inflation data for April came in slightly stronger than expected. Market focus shifts to mid-tier US data ahead of the Fed's policy announcements on Wednesday.
GBP/USD recovers to 1.2550 despite US Dollar strength

GBP/USD is recovering losses to trade near 1.2550 in the European session on Tuesday. The pair rebounds despite a cautious risk tone and broad US Dollar strength. Investors await macroeconomic data releases from the US.
Gold extends daily slide toward $2,310 ahead of US data

Gold stays under bearish pressure and declines toward $2,310 on Tuesday. The benchmark 10-year US Treasury bond yield holds steady at around 4.6% ahead of US data, making it difficult for XAU/USD to stage a rebound.
XRP hovers above $0.51 as Ripple motion to strike new expert materials receives SEC response

Ripple (XRP) trades broadly sideways on Tuesday after closing above $0.51 on Monday as the payment firm’s legal battle against the US Securities and Exchange Commission (SEC) persists.
Mixed earnings for Europe as battle against inflation in UK takes step forward

Corporate updates are dominating this morning after HSBC’s earnings report contained the surprise news that its CEO is stepping down after 5 years in the job. However, HSBC’s share price is rising this morning and is higher by nearly 2%.
