EUR/USD Current Price: 1.1400
View Live Chart for the EUR/USD
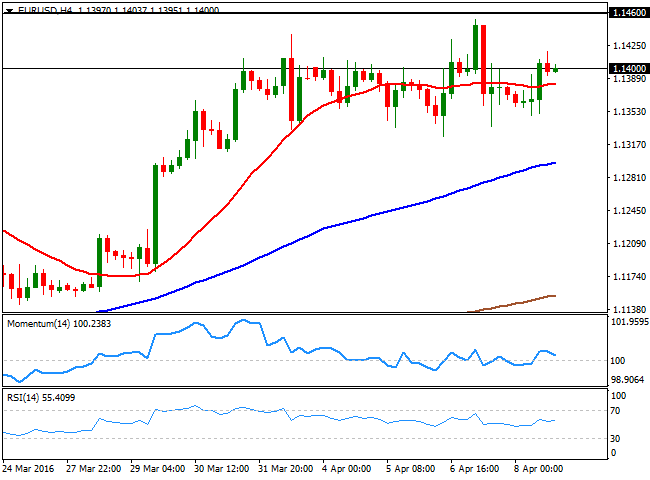
The EUR/USD pair closed the week flat at 1.1400, but not before establishing a fresh year high of 1.1453. Despite both Central Banks released the Minutes of their latest meetings, markets were driven by mood swings and equities´ moves, with macroeconomic data doing little for currencies. On Friday, risk aversion receded somehow, leading to some stabilization in stocks and further recoveries in commodities prices, but at the same time, leaving currencies directionless.
Sentiment is expected to continue leading the FX board during the upcoming days, but there are a couple of US macroeconomic releases that can determinate dollar's fate, those are March inflation and Retail Sales. The first is expected to have surged partly due to higher gasoline prices, whilst the second will likely disappoint, by showing a modest rise, in line with the previous months readings.
From a technical point of view, further gains in the pair will depend on a clear break above the 1.1460 price zone, as with just one short-lived exception, strong selling interest has contained price's advances around it since January 2015. Should the price extend beyond it, it would likely trigger stops and result in a strong rally up to 1.1714, 2015 yearly high. Daily basis, the bias is higher, as the technical indicators keep heading north within positive territory, whilst the 20 DMA maintains a strong bullish slope below the current level. Furthermore, the 100 DMA has extended its rally and is about to cross above the 200 DMA, something that should support a longer term advance. Shorter term, and due to this past week limited range, the pair maintains a neutral stance, with intraday buying interest aligned around 1.1330.
Support levels: 1.1330 1.1280 1.1245
Resistance levels: 1.1420 1.1460 1.1500
EUR/JPY Current price: 123.31
View Live Chart for the EUR/JPY
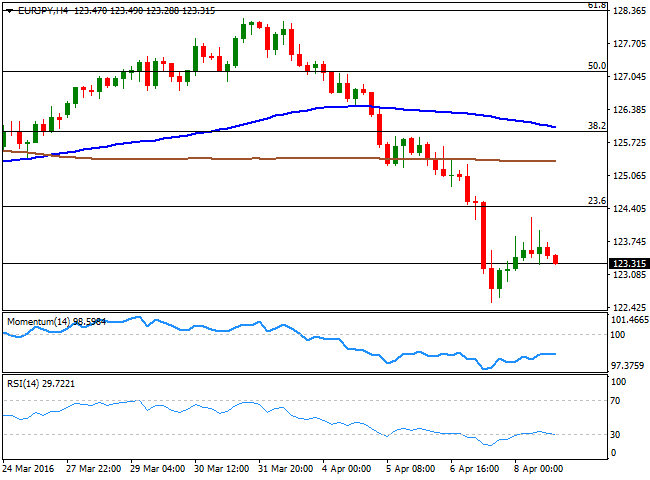
The EUR/JPY pair closed the week at 123.31, after trading as low as 122.52 on Thursday, the lowest in five weeks. The pair rallied intraday up to 124.22 on Friday, after Japan's finance minister warned of a possible intervention to weaken the currency. But speculative yen's buying interest resumed at better levels, and the pair trimmed most of its daily gains. Technically, the pair is not far from this year low set at 122.02 last March, and its poised to extend its decline to fresh multi-year lows, given that in the daily chart, the price has accelerated its decline after failing to overcome a strongly bearish 100 DMA, whilst the technical indicators remain well into negative territory, with no signs of turning higher. Shorter term, the 4 hours chart shows that the technical indicators have turned south near oversold territory, following a correction of extreme oversold readings, indicating the risk remains towards the downside.
Support levels: 123.00 122.50 122.00
Resistance levels: 123.65 124.00 124.40
GBP/USD Current price: 1.4126
View Live Chart for the GBP/USD
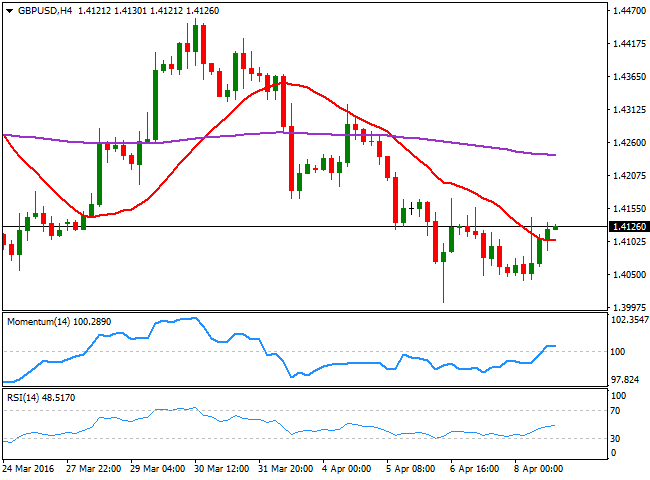
The GBP/USD pair edged higher on Friday, but closed the week in the red, with the Pound being weighed by poor UK data and continued fears over a Brexit. Production in the manufacturing sector fell by 1.1% in February, well beyond market's expectations, whilst industrial production fell by 0.3% monthly basis, also missing forecast. The offered tone in the greenback, however, alongside with an uptick in the UK's NIESR GDP Estimate up to 0.3% for March against February’s 0.2% advance, were behind Friday's gains in the pair. The recovery was not enough to confirm an interim bottom, as it will take a solid recovery beyond the 1.4500 figure to suggest a stepper recovery, something quite unlikely before the UK referendum, scheduled for late June. In the daily chart, the technical indicators have recovered partially from negative territory, but is still not enough to confirm additional gains for this Monday, as the price is developing well below its 20 DMA around 1.4250. In the shorter term, the 4 hours chart presents a limited upward potential, as the price is currently a handful of pips above a mild bearish 20 SMA, whilst the technical indicators have turned flat after entering positive territory, lacking directional strength.
Support levels: 1.4090 1.4050 1.4005
Resistance levels: 1.4145 1.4185 1.4250
USD/JPY Current price: 108.38
View Live Chart for the USD/JPY
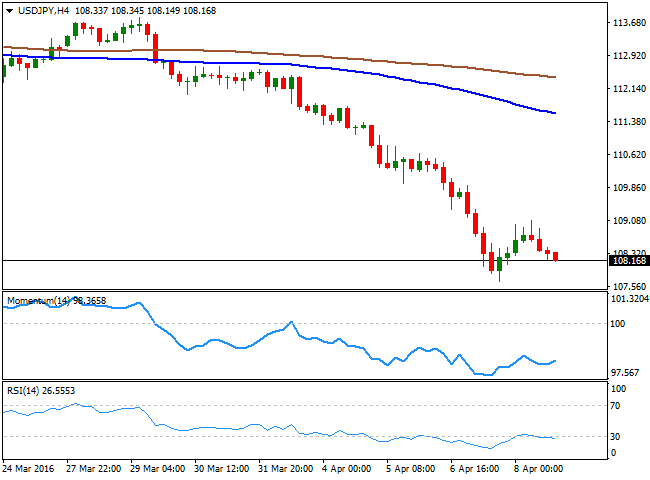
The Japanese yen retreated early Friday, partially due to a recovery in oil and stocks, which diminished risk aversion and pushed investors away from the safe haven asset, but also after Japanese Finance Minister Taro Aso warned about the rapid appreciation of the currency being undesirable, a clear sign that the government is getting ready to intervene, should the rally in the JPY continues. On the data front, Japan’s current account surplus rose by 2.43 trillion yen (versus 2.3 trillion yen median forecast) from 520 billion yen in January. Anyway, the latest yen's strength will likely result in a less-impressive surplus during the past two months, neutralizing the effect of the positive figure. The pair remains biased lower according to technical readings, given that in the daily chart, the price has extended further below its 100 and 200 DMAs that maintain strong bearish slopes, whilst the technical indicators continue heading lower, despite being in extreme oversold territory. In the 4 hours chart, the RSI indicator has turned back south within oversold territory after correcting extreme readings, whilst the Momentum indicator remains flat well below its 100 level, also supporting additional declines, particularly if the 108.00 level gives up.
Support levels: 108.00 107.65 107.30
Resistance levels: 108.45 108.90 109.35
AUD/USD Current price: 0.7551
View Live Chart for the AUD/USD
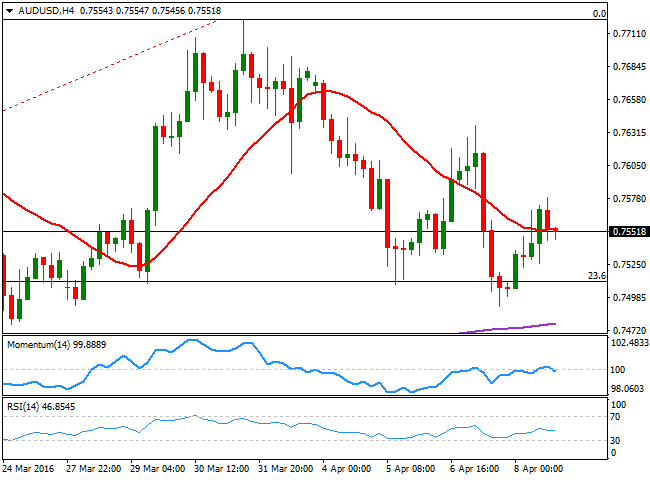
The Australian dollar recovered some ground on Friday, supported by broad dollar's weakness and a sharp bounce in oil prices. The AUD/USD pair closed the week in the red, however, around 0.7550, having consolidated in a well-defined range for a third consecutive week. After topping at 0.7722 late March, the pair has been unable to regain its preceding bullish trend, although approaches to the 0.7500 region have been steadily attracting buying interest. Having closed the week near this last, the daily chart shows that the price remains above the 23.6% retracement of its latest bullish run, whilst the technical indicators hover within neutral territory, unable to set a clear directional bias. In the same chart, the price is now below a flat 20 SMA, currently around 0.7580, the immediate short term resistance. In the 4 hours chart, the price hovers around a bearish 20 SMA, whilst the technical indicators have turned south, but also stand within neutral territory. At this point, the pair needs to break below 0.7470, the low for these last three weeks, to confirm a new leg south towards the 0.7380 region, the 38.2% retracement of the same rally.
Support levels: 0.7510 0.7470 0.7435
Resistance levels: 0.7580 0.7620 0.7660
Information on these pages contains forward-looking statements that involve risks and uncertainties. Markets and instruments profiled on this page are for informational purposes only and should not in any way come across as a recommendation to buy or sell in these assets. You should do your own thorough research before making any investment decisions. FXStreet does not in any way guarantee that this information is free from mistakes, errors, or material misstatements. It also does not guarantee that this information is of a timely nature. Investing in Open Markets involves a great deal of risk, including the loss of all or a portion of your investment, as well as emotional distress. All risks, losses and costs associated with investing, including total loss of principal, are your responsibility. The views and opinions expressed in this article are those of the authors and do not necessarily reflect the official policy or position of FXStreet nor its advertisers. The author will not be held responsible for information that is found at the end of links posted on this page.
If not otherwise explicitly mentioned in the body of the article, at the time of writing, the author has no position in any stock mentioned in this article and no business relationship with any company mentioned. The author has not received compensation for writing this article, other than from FXStreet.
FXStreet and the author do not provide personalized recommendations. The author makes no representations as to the accuracy, completeness, or suitability of this information. FXStreet and the author will not be liable for any errors, omissions or any losses, injuries or damages arising from this information and its display or use. Errors and omissions excepted.
The author and FXStreet are not registered investment advisors and nothing in this article is intended to be investment advice.
Recommended Content
Editors’ Picks
USD/JPY crashes nearly 450 pips to 155.50 on likely Japanese intervention

Having briefly recaptured 160.00, USD/JPY came under intense selling to test 155.00 on what seems like a Japanese FX intervention underway. The Yen tumbled in early trades amid news that Japan's PM lost 3 key seats in the by-election. Holiday-thinned trading exaggerates the USD/JPY price action.
AUD/USD rallies toward 0.6600 on risk flows, hawkish RBA expectations

AUD/USD extends gains toward 0.6600 in the Asian session on Monday. The Aussie pair is underpinned by increased bets of an RBA rate hike at its May policy meeting after the previous week's hot Australian CPI data. Risk flows also power the pair's upside.
Gold tests critical daily support line, will it defend?

Gold price is seeing a negative start to a new week on Monday, having booked a weekly loss. Gold price bears the brunt of resurgent US Dollar (USD) demand and a risk-on market mood amid Japanese holiday-thinned market conditions.
Ethereum fees drops to lowest level since October, ETH sustains above $3,200

Ethereum’s high transaction fees has been a sticky issue for the blockchain in the past. This led to Layer 2 chains and scaling solutions developing alternatives for users looking to transact at a lower cost.
Week ahead: Hawkish risk as Fed and NFP on tap, Eurozone data eyed too

Fed meets on Wednesday as US inflation stays elevated. Will Friday’s jobs report bring relief or more angst for the markets? Eurozone flash GDP and CPI numbers in focus for the Euro.