EUR/USD Current Price: 1.1337
View Live Chart for the EUR/USD
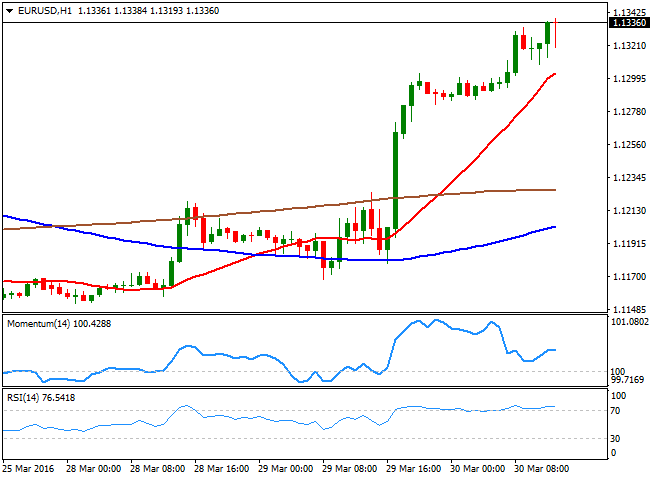
The EUR/USD pair kept rallying at the beginning of the day, as broad dollar's weakness triggered by a dovish Yellen, prevailed during Asian and European trading hours. The pair set a high of 1.1337, retreating partially ahead of the US ADP survey, which came in slightly better-than-expected, showing that the private sector added 200K new jobs in March. The pair however, held to its latest gains and near the mentioned daily high, meeting buying interest on retracements towards the 1.1300 figure. The 1 hour chart shows that the Momentum indicator diverges lower, but remains within positive territory, while the RSI indicator holds in overbought levels. In the same chart, the price is well above a bullish 20 SMA, also around the 1.1300 region, providing a strong support in the case of a retracement, quite unlikely given price developments. In the 4 hours chart, the technical indicators maintain their bullish slopes, in spite being in overbought territory, favoring some further advances towards this year high, at 1.1375.
Support levels: 1.1245 1.1190 1.1145
Resistance levels: 1.1340 1.1375 1.1420
GBP/USD Current price: 1.4427
View Live Chart for the GBP/USD
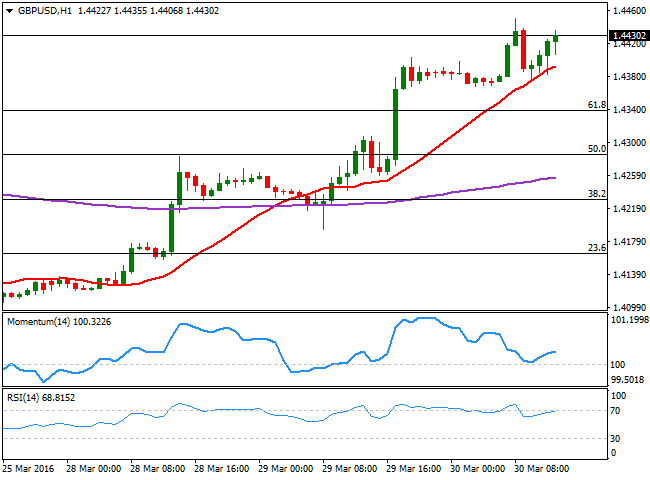
The GBP/USD pair extended its advance up to 1.4450 so far this Wednesday, falling early London to 1.4377, where buyers pushed the pair back above the 1.4400 level. There was no certain catalyst this week for the Pound's bullish run, but indeed a corrective movement was needed as Brexit fears have been way overstretched. Technically, the 1 hour chart shows that buyers have been surging on approaches to a bullish 20 SMA, but that the technical indicators are heading lower above their mid-lines, limiting chances of a stronger advance. In the 4 hours chart, the technical indicators have lost upward strength, but remain within overbought territory, as the 20 SMA heads sharply higher well below the current level, supporting some consolidation ahead.
Support levels: 1.4485 1.4335 1.4290
Resistance levels: 1.4460 1.4515 1.4560
USD/JPY Current price: 112.55
View Live Chart for the USD/JPY
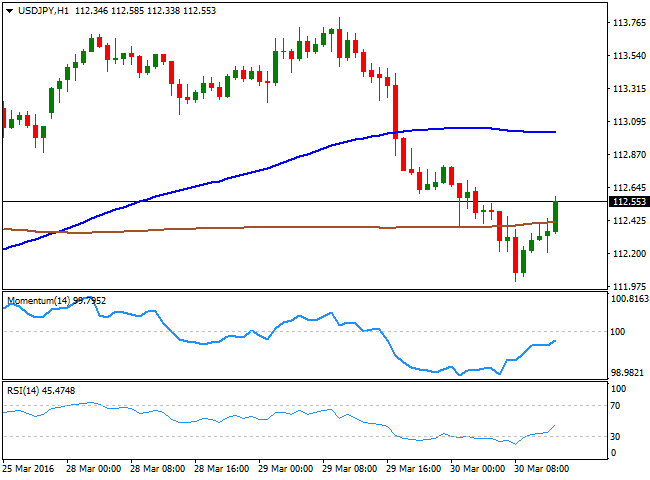
Tepid bounce, bearish tone persists. The USD/JPY pair bounces from a low set at 112.07, underpinned by a better-than-expected US ADP employment survey. The dollar however, is seeing little demand across the board, which means this recovery may be short lived. Still in the red daily basis, the 1 hour chart shows that the technical indicators have erased all of the extreme readings, and that they keep heading higher within negative territory, as the price advances beyond its 200 SMA. The 100 SMA, stands around 113.10, and is the level to beat to see a more constructive scenario. In the 4 hours chart, the technical indicators have turned higher, but remain near oversold levels, while the price is still far from its 100 and 200 SMAs, all of which maintains the risk towards the downside. Anyway, and given the strong advance in worldwide stocks, the downward potential seems limited, and a break below 111.90 is required to confirm additional declines, towards the 111.00 region.
Support levels: 112.40 111.90 111.50
Resistance levels: 113.10 113.35 113.70
AUD/USD Current price: 0.7680
View Live Chart for the AUD/USD
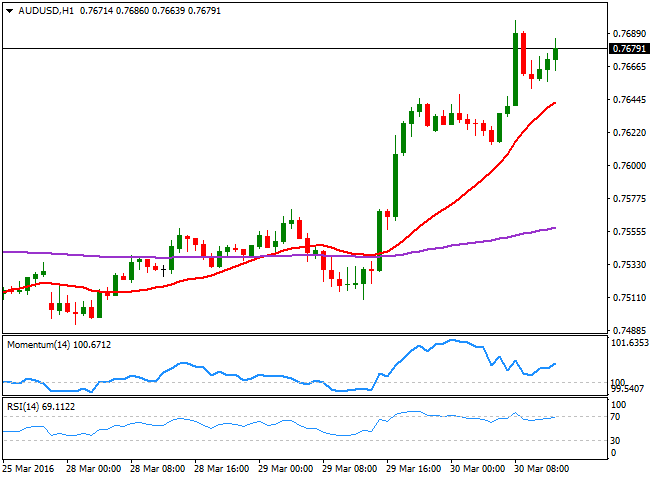
The AUD/USD pair established a fresh multi-month high at 0.7698 during the Asian session, retreating afterwards to 0.7652, the European session low. The Aussie is having a hard time to break above that 0.77 against the greenback, but the bullish trend will likely persists, due to the strong tone of stocks and commodities. Technically and in the short term, the 1 hour chart shows that the technical indicators are resuming their advances within positive territory, while the price remains far above its moving averages. In the 4 hours chart, the technical indicators are partially losing their upward strength within overbought territory, but are far from signaling a downward movement. Should the price break above the 0.7700, the rally will likely accelerate, and send the price closer to the 0.7800 region.
Support levels: 0.7610 0.7570 0.7525
Resistance levels: 0.7710 0.7765 0.7800
Information on these pages contains forward-looking statements that involve risks and uncertainties. Markets and instruments profiled on this page are for informational purposes only and should not in any way come across as a recommendation to buy or sell in these assets. You should do your own thorough research before making any investment decisions. FXStreet does not in any way guarantee that this information is free from mistakes, errors, or material misstatements. It also does not guarantee that this information is of a timely nature. Investing in Open Markets involves a great deal of risk, including the loss of all or a portion of your investment, as well as emotional distress. All risks, losses and costs associated with investing, including total loss of principal, are your responsibility. The views and opinions expressed in this article are those of the authors and do not necessarily reflect the official policy or position of FXStreet nor its advertisers. The author will not be held responsible for information that is found at the end of links posted on this page.
If not otherwise explicitly mentioned in the body of the article, at the time of writing, the author has no position in any stock mentioned in this article and no business relationship with any company mentioned. The author has not received compensation for writing this article, other than from FXStreet.
FXStreet and the author do not provide personalized recommendations. The author makes no representations as to the accuracy, completeness, or suitability of this information. FXStreet and the author will not be liable for any errors, omissions or any losses, injuries or damages arising from this information and its display or use. Errors and omissions excepted.
The author and FXStreet are not registered investment advisors and nothing in this article is intended to be investment advice.
Recommended Content
Editors’ Picks
EUR/USD holds positive ground above 1.0750 ahead of Eurozone PMI, PPI data

EUR/USD trades in positive territory for the fourth consecutive day near 1.0765 during the early Monday. The softer US Dollar provides some support to the major pair. Traders await the HCOB Purchasing Managers’ Index (PMI) data from Germany and the Eurozone, along with the Eurozone PPI.
GBP/USD rises to near 1.2550 due to dovish sentiment surrounding Fed

GBP/USD continues its winning streak for the fourth consecutive day, trading around 1.2550 during the Asian trading hours on Monday. The appreciation of the pair could be attributed to the recalibrated expectations for the Fed's interest rate cuts in 2024 following the release of lower-than-expected US jobs data.
Gold price rebounds on downbeat NFP data, softer US Dollar

Gold price snaps the two-day losing streak during the Asian session on Monday. The weaker-than-expected US employment reports have boosted the odds of a September rate cut from the US Federal Reserve. This, in turn, has dragged the US Dollar lower and lifted the USD-denominated gold.
Bitcoin Cash could become a Cardano partnerchain as 66% of 11.3K voters say “Aye”

Bitcoin Cash is the current mania in the Cardano ecosystem following a proposal by the network’s executive inviting the public to vote on X, about a possible integration.
Week ahead: BoE and RBA decisions headline a calm week

Bank of England meets on Thursday, unlikely to signal rate cuts. Reserve Bank of Australia could maintain a higher-for-longer stance. Elsewhere, Bank of Japan releases summary of opinions.


