EUR/USD Current Price: 1.0897
View Live Chart for the EUR/USD
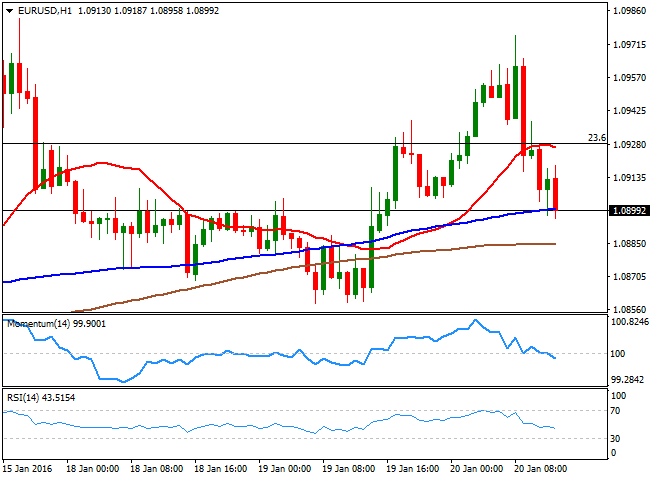
Risk trading led the way early Wednesday, with the EUR/USD pair reaching a daily high of 1.0975 as European stocks opened sharply lower following Asian ones nosedive. The negative sentiment remains, but the common currency turned lower against the greenback alongside with the Japanese yen, after the Bank of Japan warned that "they are closely watching" price developments, with no other fundamental reason for the intraday decline. Is true, the pair was near the top of its latest range, approaching the selling zone that contained rallies ever since mid December. Worse than expected US CPI readings, down by 0.1% in December, should keep the downside limited during the upcoming US session, but the technical picture shows that the price faltered around its 100 DMA, while in the short term, the 1 hour chart shows that the price is at fresh daily lows and breaking below its 100 SMA, while the technical indicators head south below their mid-lines, increasing the risk of further declines. In the 4 hours chart, however, the technical indicators maintain a neutral stance, while the price is back between its moving averages.
Support levels: 1.0880 1.0845 1.0800
Resistance levels: 1.0925 1.0965 1.1000
GBP/USD Current price: 1.4172
View Live Chart for the GBP/USD
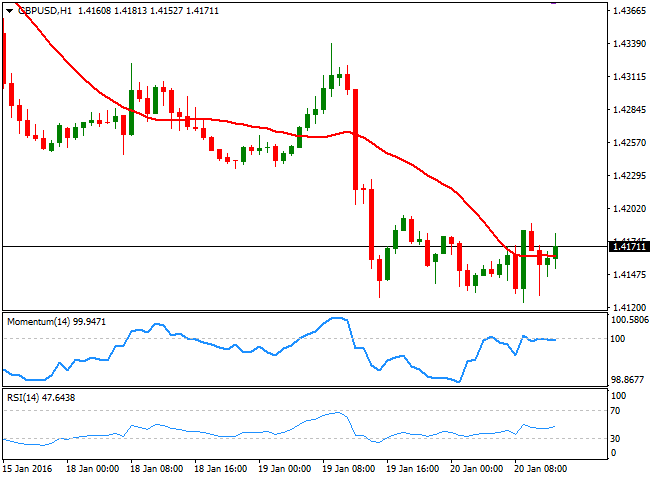
The GBP/USD pair trades near a fresh low set at 1.4124, having been unable to rally despite the UK employment report resulted generally positive, as wages remained high in spite of rising 1.9%, slightly below expected, and the unemployment rate fell to 5.1% the lowest since early 2006. The pair however, is unable to advance beyond 1.4200, and the 1 hour chart shows that the price is currently struggling around a flat 20 SMA, while the technical indicators head slightly lower below their mid-lines, without actual momentum. In the 4 hours chart, the 20 SMA has declined above the current level, and has been a key dynamic resistance for over two weeks, now capping the upside at 1.4225. In the same chart, the technical indicators remain within negative territory, with no certain directional strength, but maintaining the risk towards the downside
Support levels: 1.4125 1.4080 1.4030
Resistance levels: 1.4215 1.4250 1.4290
USD/JPY Current price: 116.64
View Live Chart for the USD/JPY
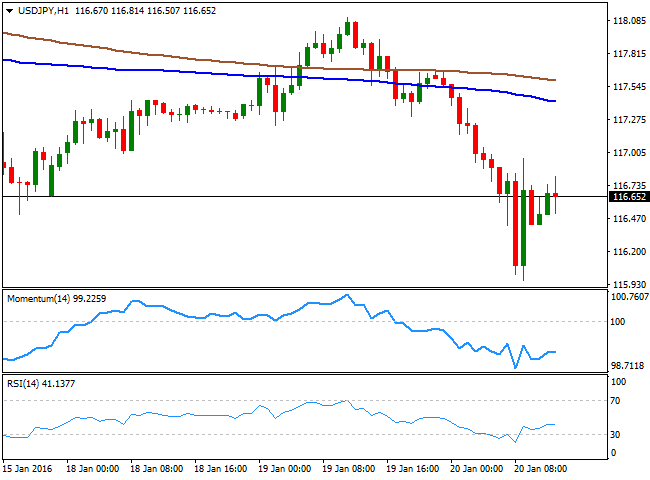
BOJ gave bears a warning, but trend will likely prevail. The USD/JPY pair plummeted briefly below the 116.00 level, reaching 115.96 before bouncing sharply higher following comments coming from the BOJ about watching yen's developments. Investors feared an intervention, as the Bank of Japan don't want a stronger yen, and quickly took profits out of the table. But the short term bounce is far from confirming and a bottom, and if risk aversion returns, if won't be strange to see the pair plummeting to fresh lows. Technically, the 1 hour chart shows that the technical indicators have corrected extreme oversold readings but are losing upward strength far below their mid-lines, while the price is well below its 100 and 200 SMAs, both heading lower beyond the 117.00 figure. In the 4 hours chart, the technical indicators have turned higher from near oversold territory, but also remain in negative territory, while the 100 SMA extended its decline further above the current level, in line with the dominant bearish trend.
Support levels: 116.40 115.95 115.50
Resistance levels: 117.00 117.35 117.70
Information on these pages contains forward-looking statements that involve risks and uncertainties. Markets and instruments profiled on this page are for informational purposes only and should not in any way come across as a recommendation to buy or sell in these assets. You should do your own thorough research before making any investment decisions. FXStreet does not in any way guarantee that this information is free from mistakes, errors, or material misstatements. It also does not guarantee that this information is of a timely nature. Investing in Open Markets involves a great deal of risk, including the loss of all or a portion of your investment, as well as emotional distress. All risks, losses and costs associated with investing, including total loss of principal, are your responsibility. The views and opinions expressed in this article are those of the authors and do not necessarily reflect the official policy or position of FXStreet nor its advertisers. The author will not be held responsible for information that is found at the end of links posted on this page.
If not otherwise explicitly mentioned in the body of the article, at the time of writing, the author has no position in any stock mentioned in this article and no business relationship with any company mentioned. The author has not received compensation for writing this article, other than from FXStreet.
FXStreet and the author do not provide personalized recommendations. The author makes no representations as to the accuracy, completeness, or suitability of this information. FXStreet and the author will not be liable for any errors, omissions or any losses, injuries or damages arising from this information and its display or use. Errors and omissions excepted.
The author and FXStreet are not registered investment advisors and nothing in this article is intended to be investment advice.
Recommended Content
Editors’ Picks
EUR/USD rises toward 1.0800 on USD weakness

EUR/USD trades in positive territory above 1.0750 in the second half of the day on Monday. The US Dollar struggles to find demand as investors reassess the Fed's rate outlook following Friday's disappointing labor market data.
GBP/USD closes in on 1.2600 as risk mood improves

Following Friday's volatile action, GBP/USD pushes higher toward 1.2600 on Monday. Soft April jobs report from the US and the improvement seen in risk mood make it difficult for the US Dollar to gather strength.
Gold holds on to modest gains around $2,320

Gold trades decisively higher on the day above $2,320 in the American session. Retreating US Treasury bond yields after weaker-than-expected US employment data and escalating geopolitical tensions help XAU/USD stretch higher.
Addressing the crypto investor dilemma: To invest or not? Premium

Bitcoin price trades around $63,000 with no directional bias. The consolidation has pushed crypto investors into a state of uncertainty. Investors can expect a bullish directional bias above $70,000 and a bearish one below $50,000.
Three fundamentals for the week: Two central bank decisions and one sensitive US Premium

The Reserve Bank of Australia is set to strike a more hawkish tone, reversing its dovish shift. Policymakers at the Bank of England may open the door to a rate cut in June.


