EUR/USD Current price: 1.1229
View Live Chart for the EUR/USD

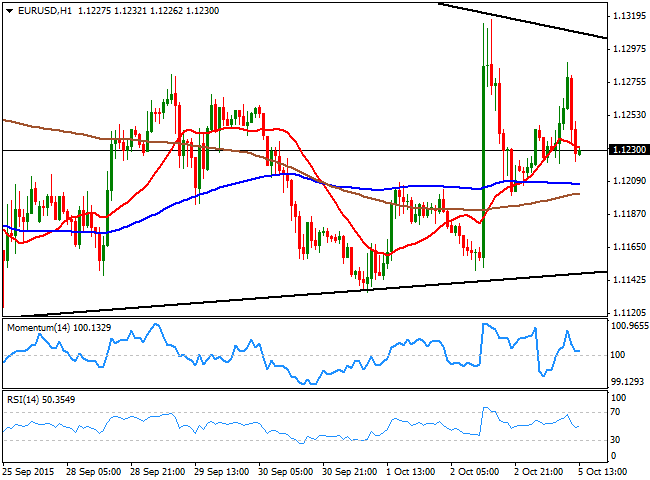
The EUR/USD pair started the day with a strong footing, advancing up to 1.1288 early in the European session, despite local data resulted mixed. Retail Sales in the EU for August resulted above expected, but well below the previous month readings, holding flat monthly basis, and growing 2.3% compared to a year before. The Markit Services PMI surveys for September across the region resulted pretty soft, as only France figures managed to beat expectations, whilst the rest resulted slightly below August numbers, but generally speaking, in line with the tepid growth seen in the region during the third quarter. Later today, the US will release its Markit and ISM services PMI, which may set the tone during the American afternoon.
In the meantime, stocks trade up in Europe, while US future also point for a strong opening. The EUR/USD pair however, was unable to extend its gains, and retreated from the mentioned high down to the 1.1220/30 price zone where it stands, and the 1 hour chart shows that the price is now struggling around its 20 SMA, while the technical indicators are attempting to recover from their mid-lines after correcting from near overbought levels, limiting chances of a stronger decline. In the 4 hours chart, the price is well above a flat 20 SMA whilst the technical indicators have lost their upward strength, but remain in positive territory. Should the pair manage to extend beyond the daily high, the rally can extend up to 1.1335, in route to 1.1400 during the upcoming sessions.
Support levels: 1.1190 1.1155 1.1120
Resistance levels: 1.1245 1.1290 1.1335
GBP/USD Current price: 1.5182
View Live Chart for the GPB/USD
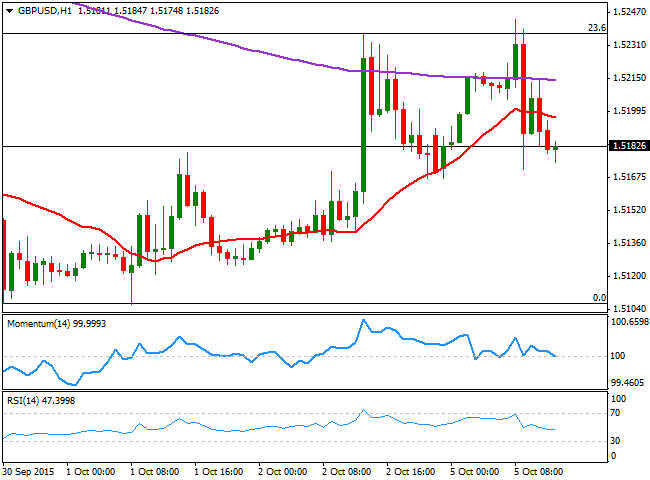
The GBP/USD pair posted a daily high of 1.5247, meeting intraday selling interest around the 23.6% retracement of its latest daily decline, also weighed by worse-than-expected UK Markit Services PMI figures for September, which came out at 53.3 against previous 55.6 and expectations of 56.0. The pair gave back its daily gains and trades below the 1.5200 figure, with an increasing bearish potential in the short term, as the 1 hour chart shows that the price is now extending below a bearish 20 SMA, whilst the technical indicators have crossed their mid-lines towards the downside. In the 4 hours chart, however, the price is still above its 20 SMA, now the immediate support around 1.5160, whilst the technical indicators turned south, but remain above their mid-lines.
Support levels: 1.5160 1.5125 1.5090
Resistance levels: 1.5235 1.5280 1.5320
USD/JPY Current price: 120.19
View Live Chart for the USD/JPY
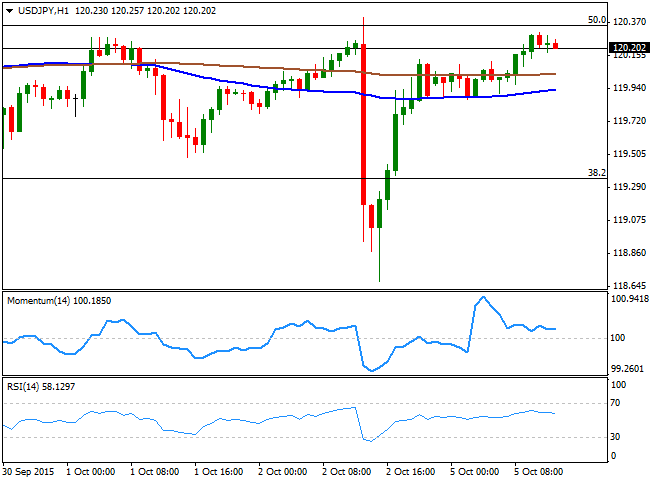
Break above 120.35 required. The USD/JPY pair is back to its usual tight range, having traded between 119.88 and 120.30 so far today, capped below the 50% retracement of its latest weekly slump. The strong upward momentum in stocks is doing little for the pair, although should limit chances of a decline, particularly if US indexes extend their pre-opening gains. Technically, the 1 hour chart shows that the price is holding a handful of pips above its 100 and 200 SMAs that anyway lack directional strength, whilst the technical indicators have retreated in positive territory, but remain flat above their mid-lines. In the 4 hours chart the 200 SMA has extended its decline and caps the upside around the mentioned high, whilst the 100 SMA remains flat a few pips below the current level, both reflecting the ongoing range that extends since late August. In this last time frame, the technical indicators are neutral. An upward acceleration above 120.35 should help the pair extending its intraday advance towards the 121.00 price zone, while below 120.00 the pair can extend down to 119.60.
Support levels: 120.00 119.60 119.35
Resistance levels: 120.35 120.70 121.10
AUD/USD Current price: 0.7087
View Live Chart for the AUD/USD
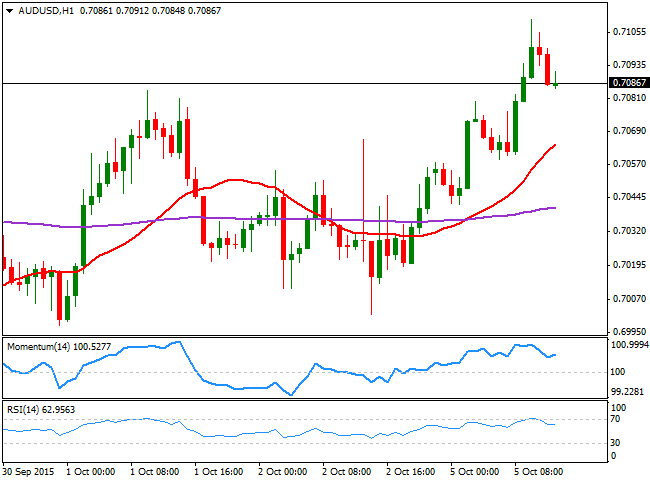
The Australian dollar surged against the greenback up to 0.7110, as commodity currencies remain the most favored ever since poor US employment data boosted stocks and bright metal prices. The pair pulled back some as gold prices are also retreating some, but the short term picture continues favoring the upside, as the price is well above a bullish 20 SMA, whilst the technical indicators turned higher after a limited downward corrective movement from overbought levels. In the 4 hours chart, the price stalled around its 200 EMA, but remains well above a bullish 20 SMA, while the technical indicators have lost their upward strength and turned lower above their mid-lines. A break above the daily high is now required to confirm additional intraday gains towards the 0.7200 level.
Support levels: 0.7070 0.7030 0.7000
Resistance levels: 0.7110 0.7140 0.7190
Information on these pages contains forward-looking statements that involve risks and uncertainties. Markets and instruments profiled on this page are for informational purposes only and should not in any way come across as a recommendation to buy or sell in these assets. You should do your own thorough research before making any investment decisions. FXStreet does not in any way guarantee that this information is free from mistakes, errors, or material misstatements. It also does not guarantee that this information is of a timely nature. Investing in Open Markets involves a great deal of risk, including the loss of all or a portion of your investment, as well as emotional distress. All risks, losses and costs associated with investing, including total loss of principal, are your responsibility. The views and opinions expressed in this article are those of the authors and do not necessarily reflect the official policy or position of FXStreet nor its advertisers. The author will not be held responsible for information that is found at the end of links posted on this page.
If not otherwise explicitly mentioned in the body of the article, at the time of writing, the author has no position in any stock mentioned in this article and no business relationship with any company mentioned. The author has not received compensation for writing this article, other than from FXStreet.
FXStreet and the author do not provide personalized recommendations. The author makes no representations as to the accuracy, completeness, or suitability of this information. FXStreet and the author will not be liable for any errors, omissions or any losses, injuries or damages arising from this information and its display or use. Errors and omissions excepted.
The author and FXStreet are not registered investment advisors and nothing in this article is intended to be investment advice.
Recommended Content
Editors’ Picks
AUD/USD remains under pressure from RBA rate decision

AUD/USD spiked lower by more than 20 pips following the RBA rate announcement to test the key psychological support at 0.6600. Losing this key level could see the currency pair trek lower towards the 100-hour EMA support near 0.6580.
EUR/USD edges lower to near 1.0750 due to the upward correction in the US Dollar

EUR/USD snaps its four-day winning streak, trading around 1.0760 during the Asian hours on Tuesday. However, the Euro found support from higher-than-expected Eurozone Purchasing Managers Index data released on Monday.
Gold price extends its upside as markets react to downbeat jobs data

Gold price extends its recovery on Tuesday. The uptick of the yellow metal is bolstered by the weaker US dollar after recent US Nonfarm Payrolls (NFP) data boosted bets that the Federal Reserve would cut interest rates later this year.
Bitcoin miner Marathon Digital stock gains ground after listing by S&P Global

Following Bitcoin miner Marathon Digital's inclusion as an upcoming member of the S&P SmallCap 600, the company's stock received an 18% boost, accompanied by an $800 million rise in market cap.
The impact of economic indicators and global dynamics on the US Dollar

Recent labor market data suggest a cooling economy. The disappointing job creation and rising unemployment hint at a slackening demand for labor, which, coupled with subdued wage growth, could signal a slower economic trajectory.