EUR/USD Current price: 1.1198
View Live Chart for the EUR/USD

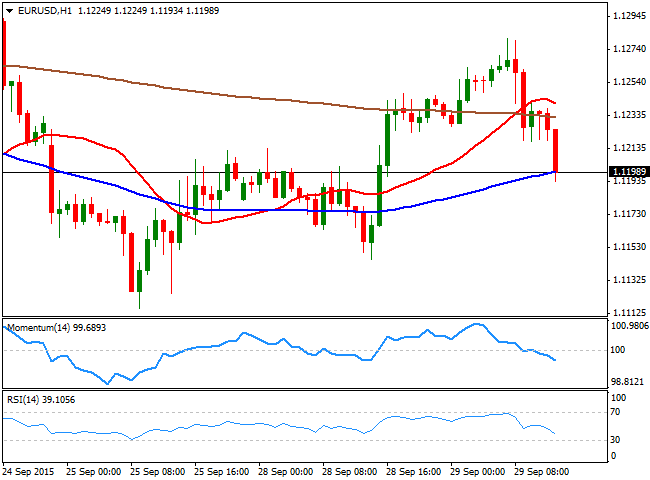
The EUR/USD pair is in retreat mode ahead of the US opening, with the pair approaching the 1.1200 figure after being as high as 1.1280 during Asian hours. The first session of the day was dominated by risk aversion, boosting demand of the common currency, albeit sentiment has changed with the European opening, as local share markets seem determinate to correct some. The improvement in sentiment, although with no clear reason for it, except maybe some bargain hunting after the latest slumps, is helping the greenback in recovering ground. The EUR/USD 1 hour chart shows that the price is back below its 20 and 200 SMAs, whilst the 100 SMA is offering a short term support around the 1.1200 figure, and the technical indicators head sharply lower below their mid-lines. In the 4 hours chart, the price is struggling around its 20 SMA, whilst the technical indicators have turned south around their mid-lines, not yet confirming a bearish continuation. Nevertheless, as long as the price holds below the 1.1245 level, the risk is towards the downside, eyeing a possible test of the 1.1120 strong static support level.
Support levels: 1.1200 1.1160 1.1120
Resistance levels: 1.1245 1.1290 1.1335
GBP/USD Current price: 1.5156
View Live Chart for the GPB/USD
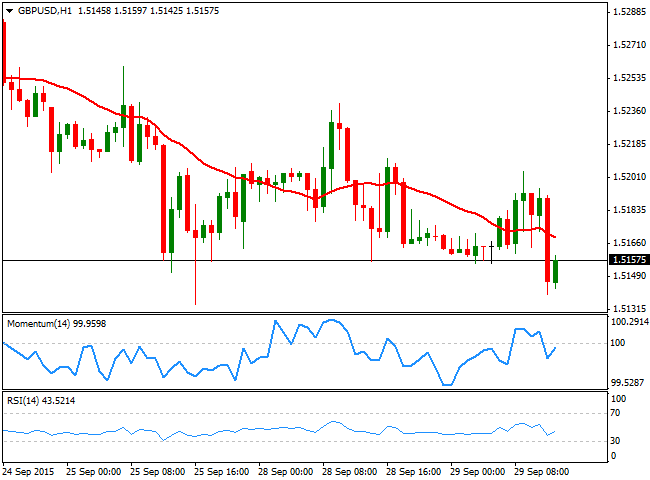
The GBP/USD pair trades lower within its recent range, having been rejected by selling interest around the 1.5200 figure on an early attempt of advancing. Data released in the UK was generally positive, with mortgage lending in August up by the most since May 2008, with net lending to individuals reaching £4.3B. The number of mortgage approvals increased to 71,030, helped by steadily low interest rates. Technically, the 1 hour chart shows that the price is below its 20 SMA whilst the technical indicators aim slightly higher around their mid-lines, lacking clear directional strength. In the 4 hours chart, the pair has been capped once again by a bearish 20 SMA, whilst the technical indicator are turning slightly lower in negative territory, in line with a bearish continuation on a break below 1.5130, this week low and the immediate support.
Support levels: 1.5130 1.5090 1.5060
Resistance levels: 1.5175 1.5210 1.5245
USD/JPY Current price: 120.00
View Live Chart for the USD/JPY
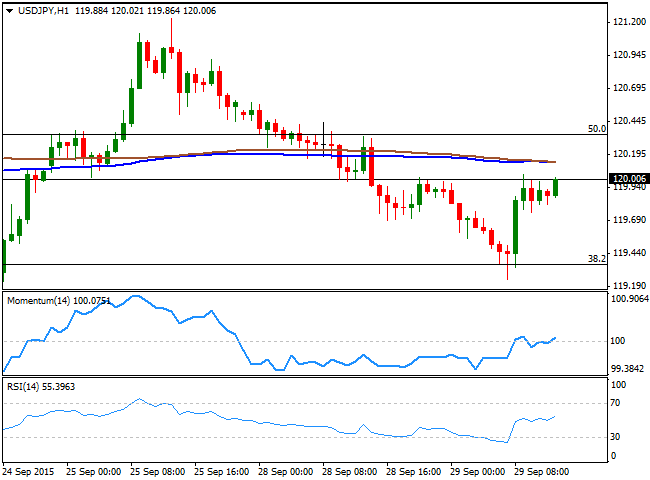
Watch 120.35 now. The USD/JPY fell down to 119.24 at the beginning of the day, with the Japanese yen strengthening amid a strong slide in Nikkei 225. The pair however, bounced back to test the 120.00 price zone, consolidating right below it ahead of Wall Street opening. Overall, range trading remains firm in place, with buyers surging around the 38.2% retracement of the latest weekly decline around 119.35, and the last line of sellers at 121.35, the 61.8% retracement of the same decline. The 1 hour chart shows that the price remains below its 100 and 200 SMAs, both together around 120.15, whilst the technical indicators head slightly higher around their mid-lines, supporting a continued advance, particularly if US indexes hold in the green. In the 4 hours chart, however, the technical outlook is bearish, as the Momentum indicator heads south below its 100 level whilst the RSI holds around 48, lacking directional strength. The immediate short term resistance is at 120.35, the 50% retracement of the mentioned rally, with some gains above it required to confirm an upward continuation during the US trading hours.
Support levels: 119.70 119.35 118.90
Resistance levels: 120.35 120.70 121.05
AUD/USD Current price: 0.6994
View Live Chart for the AUD/USD
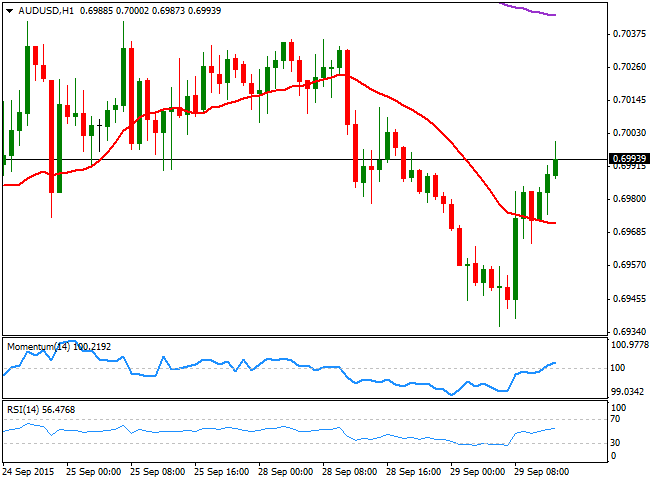
The Aussie has declined down to 0.6935 against the greenback during the past Asian session, holding above September low of 0.6906. The following recovery in the AUD/USD extended up to the 0.7000 level, where the pair is now consolidating as US traders reach their desks. Technically, the long term bearish trend is firm in place, although the short term picture suggests the pair may continue correcting higher, as the 1 hour chart shows that the price is now above its 20 SMA, whilst the technical indicators head higher above their mid-lines. In the 4 hours chart, however, the 20 SMA caps the upside around 0.7000, whilst the technical indicators aim higher, but below their mid-lines, signaling a limited upward potential at the time being.
Support levels: 0.6955 0.6930 0.6900
Resistance levels: 0.7035 0.7070 0.7110
Information on these pages contains forward-looking statements that involve risks and uncertainties. Markets and instruments profiled on this page are for informational purposes only and should not in any way come across as a recommendation to buy or sell in these assets. You should do your own thorough research before making any investment decisions. FXStreet does not in any way guarantee that this information is free from mistakes, errors, or material misstatements. It also does not guarantee that this information is of a timely nature. Investing in Open Markets involves a great deal of risk, including the loss of all or a portion of your investment, as well as emotional distress. All risks, losses and costs associated with investing, including total loss of principal, are your responsibility. The views and opinions expressed in this article are those of the authors and do not necessarily reflect the official policy or position of FXStreet nor its advertisers. The author will not be held responsible for information that is found at the end of links posted on this page.
If not otherwise explicitly mentioned in the body of the article, at the time of writing, the author has no position in any stock mentioned in this article and no business relationship with any company mentioned. The author has not received compensation for writing this article, other than from FXStreet.
FXStreet and the author do not provide personalized recommendations. The author makes no representations as to the accuracy, completeness, or suitability of this information. FXStreet and the author will not be liable for any errors, omissions or any losses, injuries or damages arising from this information and its display or use. Errors and omissions excepted.
The author and FXStreet are not registered investment advisors and nothing in this article is intended to be investment advice.
Recommended Content
Editors’ Picks
AUD/USD eases toward 0.6500 after mixed Australian trade data

AUD/USD is seeing some fresh selling interest in the Asian session on Thursday, following the release of mixed Australian trade data. The pair has stalled its recovery mode, as the US Dollar attempts a bounce after the Fed-led sell-off.
USD/JPY rebounds above 156.00 after probable Japan's intervention-led crash

USD/JPY is staging a solid comeback above 156.00, having lost nearly 450 pips in some minutes after the Japanese Yen rallied hard on another suspected Japan FX market intervention in the late American session on Wednesday.
Gold price stalls rebound below $2,330 as US Dollar recovers

Gold price is holding the rebound below $2,330 in Asian trading on Thursday, as the US Dollar recovers in sync with the USD/JPY pair and the US Treasury bond yields, in the aftermath of the Fed decision and the likely Japanese FX intervention.
Solana price dumps 21% on week as round three of FTX estate sale of SOL commences

Solana price is down almost 5% in the past 24 hours and over 20% in the last seven days. The dump comes as the broader crypto market contracts with Bitcoin price leading the pack as it slides below the $58,000 threshold to test the Bull Market Support Band Indicator.
The FOMC whipsaw and more Yen intervention in focus

Market participants clung to every word uttered by Chair Powell as risk assets whipped around in a frenetic fashion during the afternoon US trading session.


