EUR/USD Current price: 1.1210
View Live Chart for the EUR/USD
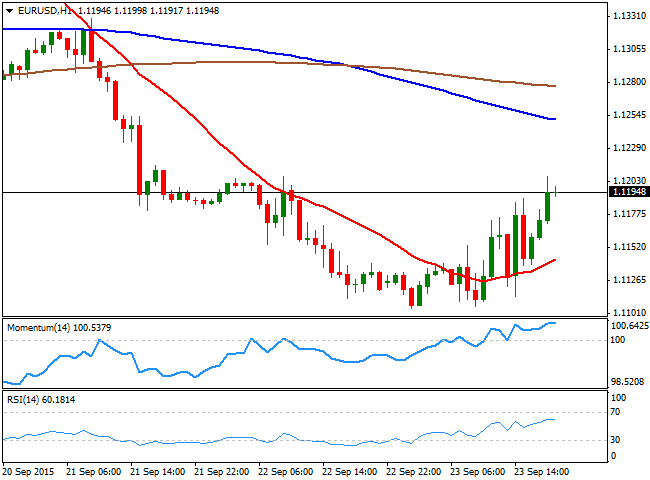
The EUR/USD pair erased all of it Tuesday's losses and recovered up to a daily high of 1.1212 during the American afternoon, recovering from a 3-week high set at 1.1104 after Mario Draghi's testimony before the Economic and Monetary Affairs Committee, where he repeated the mantra of more QE being possible if needed, but saying also that it's too soon to pledge additional stimulus. Investors had been speculating that due to the increasing risk of a global slowdown, the Central Bank would be more willing to add stimulus to the economy. Also, the Markit flash PMI data for the EU for September, showed that the euro-zone economy grew steadily at the end of the third quarter, although the final figures miss expectations. In the US however, growth remained relatively subdued, as the Markit Flash Manufacturing PMI registered 53.0 in September, unchanged at almost a 2-year low.The pair however, is finding some selling interest as earlier this week in the 1.1200/10 price zone, but the 1 hour chart shows that the price is well above a bullish 20 SMA, whilst the technical indicators have lost their upward strength, but hold in positive territory, suggesting the upward movement may extend, as long as buyers defend the 1.1160 level, the immediate support. In the 4 hours chart, the movement seems mostly corrective so far, as the price was unable to overcome a strongly bearish 20 SMA around the mentioned high, whilst the technical indicators continue recovering from oversold levels, but remain in negative territory.
Support levels: 1.1160 1.1120 1.1080
Resistance levels: 1.1205 1.1250 1.1290
EUR/JPY Current price: 134.64
View Live Chart for the EUR/JPY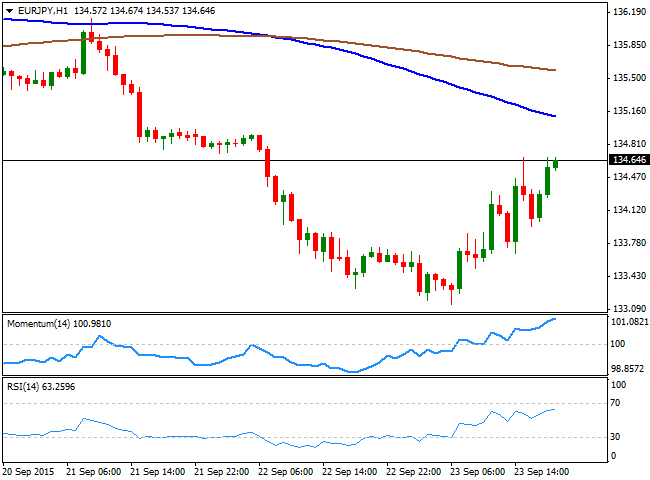
The EUR/JPY pair recovered strongly from a low set at 113.14 at the beginning of the day, trading at its highs ahead of the US close in the 134.60 price zone. Stocks edged higher in Europe, whilst the US indexes have erased most of its intraday gains and point to close mixed around their opening, limiting Japanese yen gains. Technically, the 1 hour chart shows that the upside may extend, as the technical indicators continue heading higher near overbought levels, although the 100 SMA maintains a strong bearish slope currently around 135.10, offering a strong resistance in the case of further advances. In the 4 hours chart the RSI indicator continues recovering from oversold levels, but the Momentum indicator stand path below the 100 level, suggesting an upward acceleration above the mentioned resistance is required to confirm additional gains.
Support levels: 134.40 133.90 133.30
Resistance levels: 134.80 135.10 135.50
GBP/USD Current price: 1.5255
View Live Chart for the GPB/USD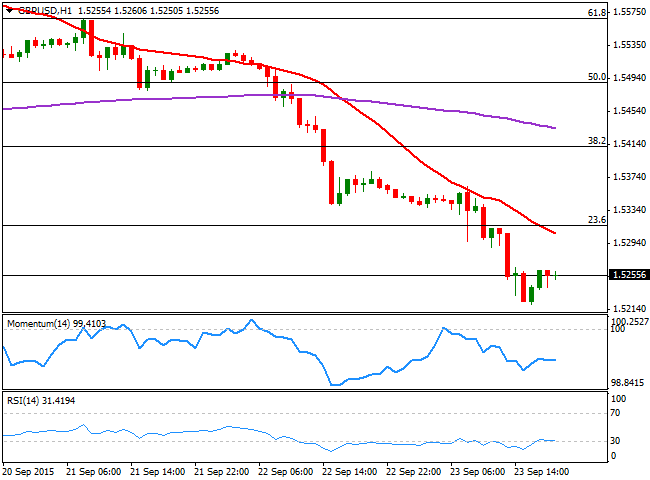
The British Pound sunk against its American rival to a fresh 2-week low of 1.5220, having posted afterwards a tepid bounce, contained by selling interest around 1.5260. There were no macroeconomic news in the UK and the calendar will remain light for the rest of the week, with only the BBA Mortgage Approvals expected for this Thursday. The heavy slide in oil prices has partially affected the Pound, but the overall decline seems based on the break of critical technical levels, ever since the day started. Short term, the pair is still in risk of further declines, as the 20 SMA extended its decline and now provides an immediate resistance around 1.5300, whilst the technical indicators have stabilized well below their mid-lines, following a correction of extreme oversold levels. In the 4 hours chart, the technical indicators are posting tepid bounces from oversold readings, rather suggesting some consolidation ahead than signaling an upward movement under way.
Support levels: 1.5220 1.5185 1.5150
Resistance levels: 1.5300 1.5340 1.5360
USD/JPY Current price: 120.21
View Live Chart for the USD/JPY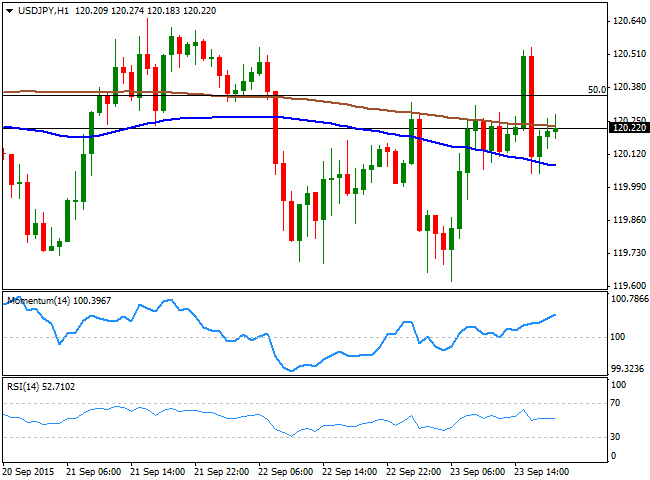
The USD/JPY pair continued trading range bound this Wednesday, having declined down to 119.61 during the previous Asian session, only to bounce up to 120.53 in the American afternoon, following Wall Street's decline. The pair trades a few pips above its daily opening, maintaining its latest range and lacking clear directional strength. Given that Japan has been on holidays ever since the week started, the new day opening may bring some definitions particularly after the release of the Japanese manufacturing PMI. In the meantime, the range is well defined by Fibonacci levels, with buyers surging around 119.30, the 38.2% retracement of its latest weekly decline, and sellers containing the upside at 121.35, the 61.8% retracement of the same rally. Technically, the 1 hour chart shows that the price is hovering below its 200 SMA, but above the 100 SMA at 120.05, while the Momentum indicator heads higher above the 100 level, but the RSI lacks strength around 51. In the 4 hours chart, the technical outlook is still neutral, although the sharp retracement from the mentioned daily high, increases chances of a bearish continuation for the upcoming hours.
Support levels: 120.05 119.70 119.35
Resistance levels: 120.35 120.70 121.05
AUD/USD Current price: 0.6998
View Live Chart for the AUD/USD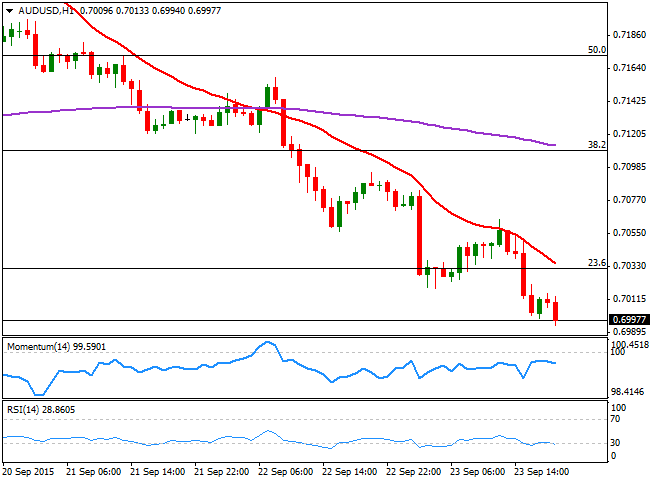
The AUD/USD pair broke below the 0.7000 figure by the end of the day, posting a third day in-a-row of strong losses. The Aussie was hit by soft Chinese data, and speculation the PBoC will introduce further easing to attempt to contain the economic slowdown. Also, a daily decline in commodities, with gold down 0.04% and oil almost 3.0% lower, should maintain the antipodean currency under pressure. Technically, the 1 hour chart shows that the 20 SMA extended its decline, and contained the upside on an early attempt of advancing, whilst the Momentum indicator is turning south below the 100 level, whilst the RSI indicator heads lower around 28. The 4 hour chart shows that the technical indicators maintain their negative tone, despite being near oversold readings, whilst the 20 SMA has turned sharply lower above the current now approaching the 38.2% retracement of the August/September decline at 0.7110. Currently trading below the 23.6% retracement of the same decline at 0.7035, a retest of the September low at 0.6906 seems likely for the upcoming sessions.
Support levels: 0.6990 0.6955 0.6906
Resistance levels: 0.7035 0.7070 0.7110
Information on these pages contains forward-looking statements that involve risks and uncertainties. Markets and instruments profiled on this page are for informational purposes only and should not in any way come across as a recommendation to buy or sell in these assets. You should do your own thorough research before making any investment decisions. FXStreet does not in any way guarantee that this information is free from mistakes, errors, or material misstatements. It also does not guarantee that this information is of a timely nature. Investing in Open Markets involves a great deal of risk, including the loss of all or a portion of your investment, as well as emotional distress. All risks, losses and costs associated with investing, including total loss of principal, are your responsibility. The views and opinions expressed in this article are those of the authors and do not necessarily reflect the official policy or position of FXStreet nor its advertisers. The author will not be held responsible for information that is found at the end of links posted on this page.
If not otherwise explicitly mentioned in the body of the article, at the time of writing, the author has no position in any stock mentioned in this article and no business relationship with any company mentioned. The author has not received compensation for writing this article, other than from FXStreet.
FXStreet and the author do not provide personalized recommendations. The author makes no representations as to the accuracy, completeness, or suitability of this information. FXStreet and the author will not be liable for any errors, omissions or any losses, injuries or damages arising from this information and its display or use. Errors and omissions excepted.
The author and FXStreet are not registered investment advisors and nothing in this article is intended to be investment advice.
Recommended Content
Editors’ Picks
EUR/USD holds firm above 1.0700 ahead of German inflation data

EUR/USD trades on a firm footing above 1.0700 early Monday. The pair stays underpinned by a softer US Dollar, courtesy of the USD/JPY sell-off and a risk-friendly market environment. Germany's inflation data is next in focus.
USD/JPY recovers after testing 155.00 on likely Japanese intervention

USD/JPY is recovering ground after crashing to 155.00 on what seemed like a Japanese FX intervention. The Yen tumbled in early trades amid news that Japan's PM lost 3 key seats in the by-election. Holiday-thinned trading exaggerates the USD/JPY price action.
Gold price bulls move to the sidelines as focus shifts to the crucial FOMC policy meeting

Gold price (XAU/USD) struggles to capitalize on its modest gains registered over the past two trading days and edges lower on the first day of a new week, albeit the downside remains cushioned.
XRP plunges to $0.50, wipes out recent gains as Ripple community debates ETHgate impact

Ripple loses all gains from the past seven days, trading at $0.50 early on Monday. XRP holders have their eyes peeled for the Securities and Exchange Commission filing of opposition brief to Ripple’s motion to strike expert testimony.
Week ahead: FOMC and jobs data in sight

May kicks off with the Federal Open Market Committee meeting and will be one to watch, scheduled to make the airwaves on Wednesday. It’s pretty much a sealed deal for a no-change decision at this week’s meeting.
