EUR/USD Current price: 1.0947
View Live Chart for the EUR/USD
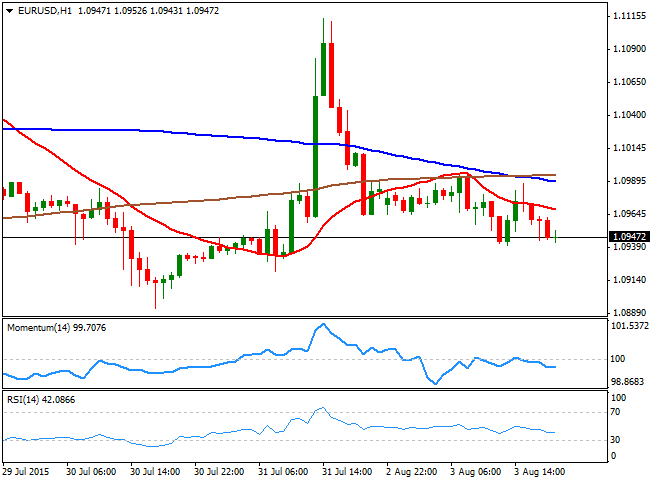
The American dollar closed the day generally higher across the board, supported amongst other things, by a slump in oil prices, with Brent crude below $ 50 and WTI nearing $ 45 a barrel. Commodities came under pressure during the Asian session following the release of poor Chinese manufacturing figures, signaling further economic slowdown in the country. In Europe, the release of local PMI for July showed that the sector continued expanding in the area, despite the Greek manufacturing PMI plunged to 30.2, which maintained the EUR limited below the 1.1000 level against the greenback. Later on in the day, US data came out mixed, with an uptick in the PCE price index, whilst personal income came up 0.4% and personal spending increased 0.2%. The ISM manufacturing fell to a 3-month low of 52.7 in July, whilst the Markit reading came out flat at 53.8. Finally, construction spending posted its smallest gain in five months, up 0.1% in June.
The EUR/USD closed the day near its daily low of 1.0940, and with the technical picture favoring another leg lower for the upcoming session, as the 1 hour chart shows that the price remained contained below its 100 SMA in its attempts to advance, while the 20 SMA heads lower above the current price and the technical indicators remain below their mid-lines, although lacking directional strength albeit the restricted intraday range. In the 4 hours chart, the price is below a bearish 20 SMA, whilst the technical indicators diverge from each other, but in neutral territory. At this point the price needs to break below the 1.0920 level to be able to extend its losses towards the 1.0840/60 region, while approaches to 1.1000 will likely continue to be seen as selling opportunities.
Support levels: 1.0920 1.0890 1.0850
Resistance levels: 1.1000 1.1050 1.1080
EUR/JPY Current Price: 135.69
View Live Chart for the EUR/JPY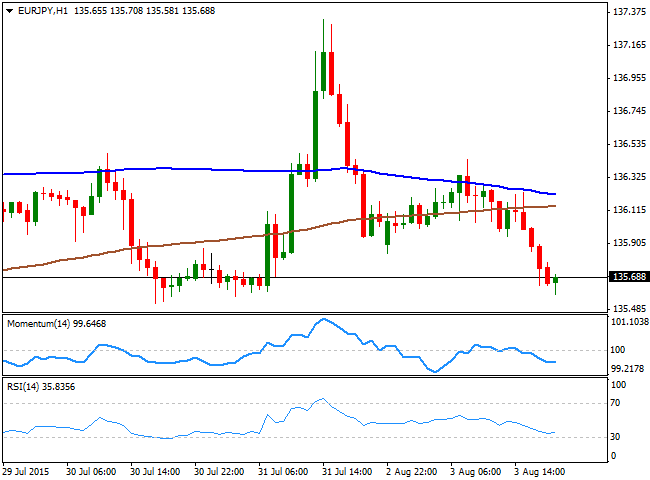
The EUR/JPY fell down to 135.58 by the end of the American session, with the Japanese yen finding strength in falling US stocks and the EUR self weakness. The pair has reached a strong static support level, suggesting a limited bounce may be seen in the current region, albeit the short term bias is bearish, as in the 1 hour chart, the pair is developing well below its 100 and 200 SMAs, whilst the technical indicators hold near oversold territory, losing their bearish strength. In the 4 hours chart, the price is a handful of pips below its 100 SMA, whilst the Momentum indicator holds flat around 100 and the RSI heads lower around 42, maintaining the risk towards the downside, despite the limited directional strength seen at the time being.
Support levels: 135.50 135.10 134.60
Resistance levels: 135.90 136.60 137.10
GBP/USD Current price: 1.5587
View Live Chart for the GPB/USD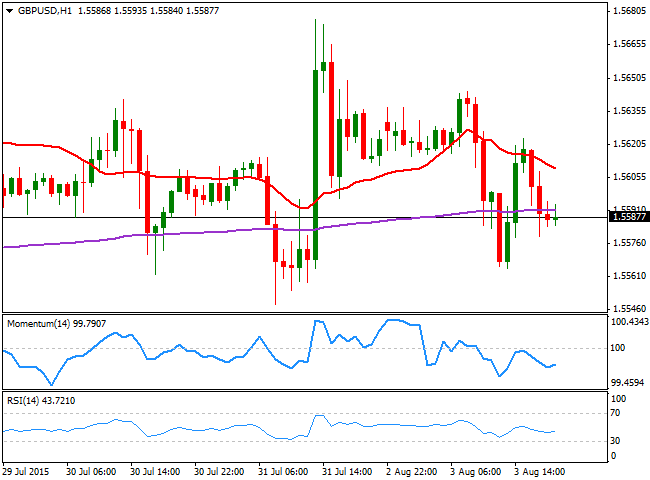
The GBP/USD pair lost the 1.5600 level during the European morning, triggering some short term stops and falling down to 1.5564, despite the UK Markit manufacturing PMI for July signaled the sector continued growing, up to 51.9 from 51.4 in June, albeit new orders grew at the slowest pace in nearly a year. The pair attempted a recovery after the American opening on the back of US tepid data, but failed to sustain its gains beyond the mentioned 1.5600 level. Technically, the 1 hour chart shows that the technical indicators aim lower below their mid-lines whilst the 20 SMA heads south around 1.5610, favoring additional declines on further declines below the mentioned daily low. In the 4 hours chart, the price has bounced from a horizontal 200 EMA that anyway provides a strong dynamic support since mid last week, and reinforces the idea of a breakthrough of the 1.5560 level to confirm a continued decline. Also, in this last chart, the 20 SMA turned south above the current level whilst the technical indicators head south below their mid-lines, in line with the bearish bias seen in smaller time frames.
Support levels: 1.5560 1.5520 1.5475
Resistance levels: 1.5600 1.5635 1.5670
USD/JPY Current price: 123.91
View Live Chart for the USD/JPY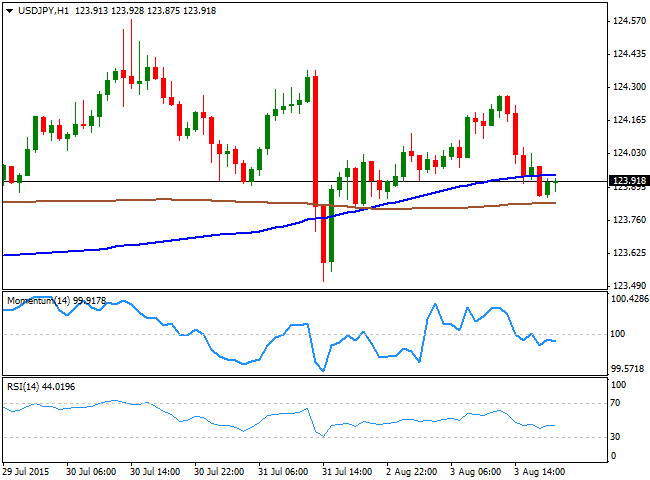
The USD/JPY pair traded as high as 124.26 during the European session, but resumed its decline following the strong sell-off in US indexes, breaking back below the 124.00 figure where it stands. The pair has remained confined to a tight intraday range, and the 1 hour chart shows that the price is now consolidating between its 100 and 200 SMAs, both within a 20 pips range, a clear reflection of the lack of directional strength in the pair, whilst the technical indicators present tepid bearish slopes below their mid-lines, favoring the downside, but not yet confirming a bearish extension. In the 4 hours chart, the technical indicators are also below their mid-lines, but heading nowhere, whilst the 100 SMA stands a few pips below the current level. There are little chances of seeing the pair gaining momentum either side of the board during the upcoming hours, and the more likely scenario is an extension of the 123.30/124.45 range until the release of the US Nonfarm Payroll report next Friday.
Support levels: 123.70 123.30 122.90
Resistance levels: 124.45 124.90 125.30
AUD/USD Current price: 0.7269
View Live Chart for the AUD/USD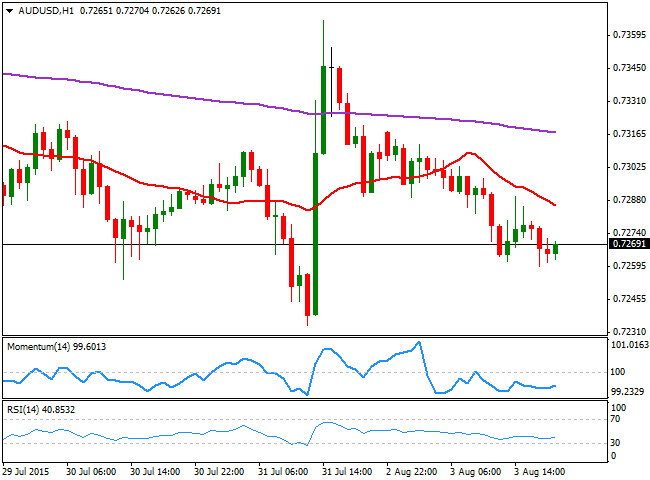
The AUD/USD pair edged lower this Monday, trading below the 0.7300 level for most of the day. Australian data resulted for the most positive, as July AIG performance of manufacturing index expanded to 50.4, while HIA new home sales rose 0.5% monthly basis in June against a prior fall of 2.3% in May. Finally, TD securities inflation ticked higher in July, resulting at 0.2%. The Aussie however, was hit by the Chinese China Caixin manufacturing PMI that contracted to a 2-year low at 47.8 in July compared with estimates of 48.2 and down from 49.4 in June. The pair however, held above 0.7250, the immediate support, and the 1 hour chart presents an increasing bearish potential, as the technical indicators stand in negative territory, whilst the 20 SMA turned sharply lower above the current price. In the 4 hours chart, the technical picture is neutral-to-bearish as the technical indicators head slightly lower below their mid-lines whilst the 20 SMA is for the most flat around 0.7300.
Support levels: 0.7250 0.7220 0.7190
Resistance levels: 0.7300 0.7340 0.7375
Recommended Content
Editors’ Picks
AUD/USD drops to 0.6550 on dismal Aussie Retail Sales and mixed China's PMIs

AUD/USD is seeing a fresh selling wave, dropping to 0.6550 after Australian Retail Sales dropped by 0.4% in March while China's NBS April PMI data came in mixed. Focus shifts to China's Caixin Manufacturing PMI data.
EUR/USD finds support near 1.0720 after slow grind on Monday

EUR/USD jostled on Monday, settling near 1.0720 after churning in a tight but lopsided range as markets settled in for the wait US Fed outing. Investors broadly expect US rates to hold steady this week, but traders will look for an uptick in Fed guidance for when rate cuts could be coming.
Gold prices soften as traders gear up for Fed monetary policy decision

Gold price snaps two days of gains, yet it remains within familiar levels, with traders bracing for the US Fed's monetary policy decision on May 1. The XAU/USD retreats below the daily open and trades at $2,334, down 0.11%, courtesy of an improvement in risk appetite.
Top 3 Price Prediction Bitcoin, Ethereum, Ripple: Relief wave on altcoins likely as BTC shows a $5,000 range

Bitcoin price has recorded lower highs over the past seven days, with a similar outlook witnessed among altcoins. Meanwhile, while altcoins display a rather disturbing outlook amid a broader market bleed, there could be some relief soon as fundamentals show.
Gearing up for a busy week: It typically doesn’t get any bigger than this

Attention this week is fixated on the Federal Reserve's policy announcement scheduled for Wednesday. While the US central bank is widely expected to remain on hold, traders will be eager to discern any signals from the Fed regarding the possibility of future interest-rate cuts.