EUR/USD Current price: 1.0946
View Live Chart for the EUR/USD

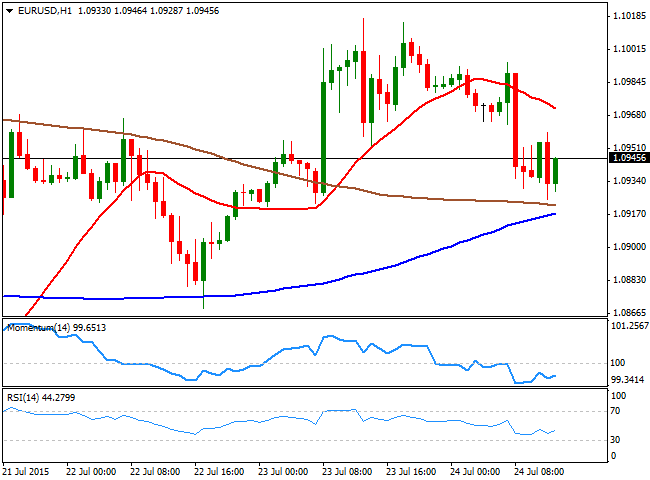
The EUR/USD pair trades near a daily low established at 1.0924, as the dollar got a boost from nose-diving commodities. The greenback strength started in Asian hours, following the release of poor Chinese manufacturing data, and accelerated with the European opening, as local manufacturing and services PMIs disappointed. In fact, the EU region numbers remained in expansionary levels, although the small tick lower from the previous month reading weighed over an already weak EUR. With US manufacturing and housing data ahead, the EUR/USD pair presents a limited intraday bearish tone, as in the 1 hour chart, the 20 SMA heads lower above the current level whilst the technical indicators are aiming to recover, but remain below their mid-lines. In the 4 hours chart, however, the downside seems more constructive as the technical indicators maintain strong bearish slopes below their mid-lines, whilst the price struggles around a bullish 20 SMA. The pair has an immediate support at 1.0920, with a break below it required to confirm additional declines towards the 1.0830 region.
Support levels: 1.0920 1.0875 1.0830
Resistance levels: 1.0950 1.1000 1.1045
GBP/USD Current price: 1.5481
View Live Chart for the GPB/USD
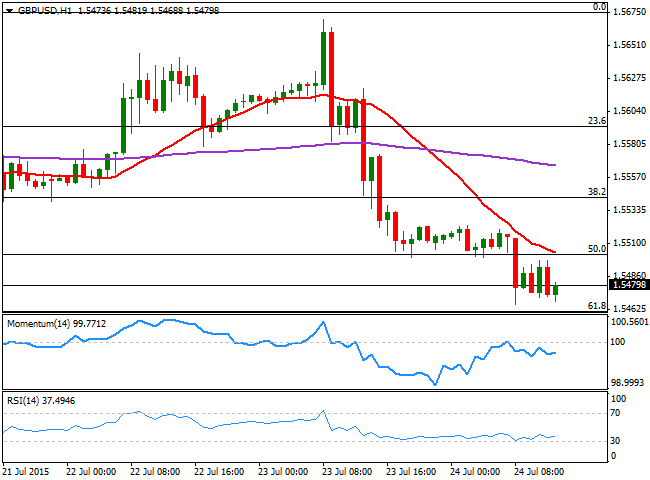
The GBP/USD pair sunk to 1.5466 this Friday, accelerating lower after breaking the key 1.5500 figure. The pair has bounced some from the 61.8% retracement of its latest bullish run at 1.5460, but consolidates below the mentioned 1.5500 level ahead of the US opening, looking for the most weak. Technically, the 1 hour chart shows that the 20 SMA continues to head lower well above the current level whilst the technical indicators lack directional strength in negative territory. In the 4 hours chart, however, the technical indicators maintain their sharp bearish slopes, despite being near oversold readings, supporting another leg lower, particularly on a break below 1.5460.
Support levels: 1.5460 1.5420 1.5385
Resistance levels: 1.5500 1.5545 1.5590
USD/JPY Current price: 123.97
View Live Chart for the USD/JPY
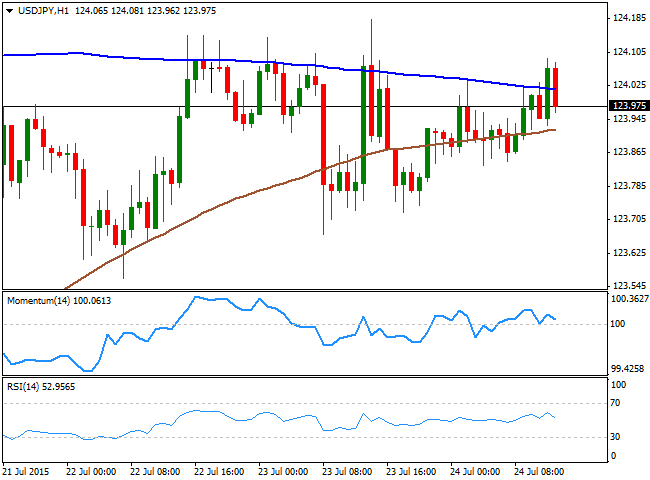
Little progress, below 124.00. The USD/JPY pair continues to trade in a tight intraday range, having advanced up to 124.09 this Friday, contained once again by strong selling interest around the level. Despite a generalized dollar strength, the upside seems quite limited, although upcoming US housing and manufacturing data, if positive, may trigger a firmer upward continuation. Short term, the 1 hour chart shows that the price is unable to extend beyond its 100 SMA, whilst the 200 SMA offers an immediate support in the 123.85 region, and the technical indicator turned south, but remain above their mid-lines. In the 4 hours chart, the bias is neutral-to-bullish, as the price holds above its moving averages that anyway remain flat around 123.30, whilst the technical indicators lack directional strength above their mid-lines. Some follow through beyond 124.45 is required to see the pair accelerating north, whilst only below the 123.30, the bears will be back in control.
Support levels: 123.85 123.30 122.90
Resistance levels: 124.20 124.45 124.90
Recommended Content
Editors’ Picks
EUR/USD retreats to 1.0750, eyes on Fedspeak

EUR/USD stays under modest bearish pressure and trades at around 1.0750 on Wednesday. Hawkish comments from Fed officials help the US Dollar stay resilient and don't allow the pair to stage a rebound.
GBP/USD struggles to hold above 1.2500 ahead of Thursday's BoE event

GBP/USD stays on the back foot and trades in negative territory below 1.2500 after losing nearly 0.5% on Tuesday. The renewed US Dollar strength on hawkish Fed comments weighs on the pair as market focus shifts to the BoE's policy announcements on Thursday.
Gold fluctuates in narrow range above $2,300

Gold struggles to make a decisive move in either direction and moves sideways in a narrow channel above $2,300. The benchmark 10-year US Treasury bond yield clings to modest gains near 4.5% and limits XAU/USD's upside.
SEC vs. Ripple lawsuit sees redacted filing go public, XRP dips to $0.51

Ripple (XRP) dipped to $0.51 low on Wednesday, erasing its gains from earlier this week. The Securities and Exchange Commission (SEC) filing is now public, in its redacted version.
Softer growth, cooler inflation and rate cuts remain on the horizon

Economic growth in the US appears to be in solid shape. Although real GDP growth came in well below consensus expectations, the headline miss was mostly the result of larger-than-anticipated drags from trade and inventories.