EUR/USD Current price: 1.1081
View Live Chart for the EUR/USD
A tepid US employment report forced the greenback down against most rivals, after being on demand during Asian and European hours. The American dollar edged slightly lower across the board, as the June payrolls report showed that the country added 223,000 jobs, slightly below expectations, whilst wages were unchanged from the previous month. The previous month reading was revised lower, from 280K to 254K, adding to the negativity of the report, albeit the unemployment rate fell to a 7-year low of 5.3%, as more people left the labor force. In Europe, the daily note from Greece came from Finance Minister Varoufakis, who stated that he would resign if the "YES" wins the weekend referendum, adding also that he rather cut his arm off than signing a deal that does not contemplate debt relief. On Friday, US markets will remain closed on holiday, anticipating little volatility across the board.
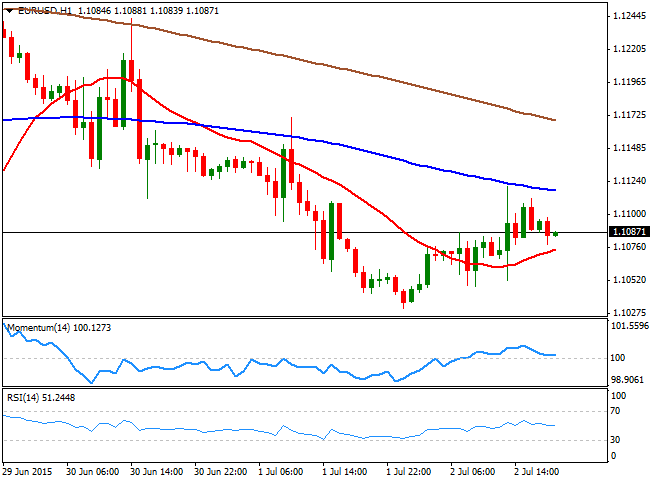
As for the EUR/USD technical picture, the pair surged up to 1.1120 following the release of the US data, but was quickly rejected, spending the rest of the day in a tight consolidative range below the 1.1100 figure. The 1 hour chart shows that the price stalled around a bearish 100 SMA that maintains its bearish slope above the current levels, whilst the technical indicators have lost their upward strength, and lie now flat in neutral territory. In the 4 hours chart, a bearish tone persists since the price was unable to recover above its 20 SMA, whilst the technical indicators have resumed their decline below their mid-lines. Should the pair break below the 1.1050 support, the risk turns towards the downside, pointing for an approach to the 1.1000 figure.
Support levels: 1.1050 1.1010 1.0960
Resistance levels: 1.1120 1.1160 1.1200
EUR/JPY Current price: 136.42
View Live Chart for the EUR/JPY
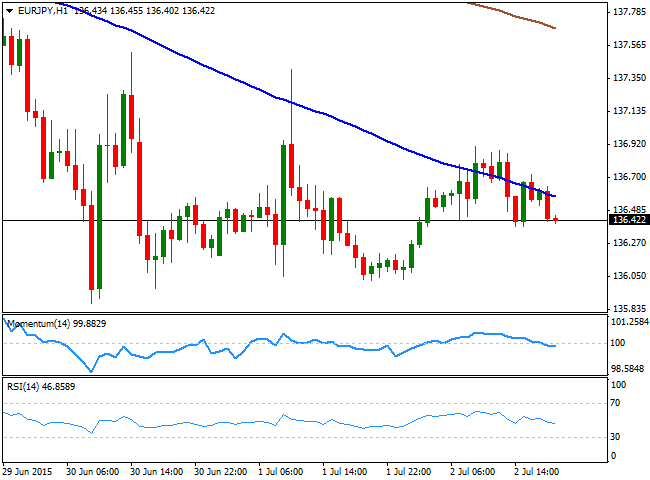
The EUR/JPY pair continues trading in quite a limited range daily basis unable to gain directional strength. Daily basis, the pair has added some 30 pips, showing little demand for the common currency. The short term picture is neutral-to-bearish, as the price is being limited by a bearish 100 SMA, currently around 136.60, whilst the technical indicators present mild negative slopes around their mid-lines. In the 4 hours chart, the technical indicators turned lower after being rejected from their mid-lines, showing no actual bearish strength at the time being, whilst the price remains below its moving averages, with the 200 SMA offering a strong dynamic resistance around 137.50. The main support stands at 135.80, with a break below it required to confirm a downward acceleration towards the 134.90/135.00 price zone.
Support levels: 135.80 135.35 134.90
Resistance levels: 136.40 136.90 137.50
GBP/USD Current price: 1.5606
View Live Chart for the GBP/USD
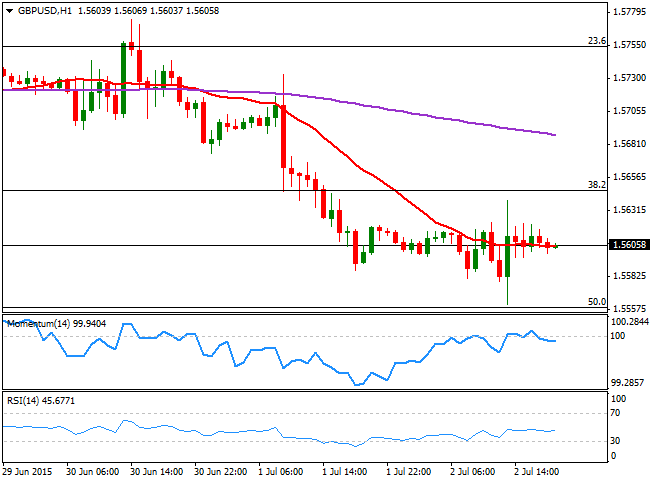
The British Pound enjoyed some temporal relief earlier in the day, as Britain's construction data, showed that the sector rebounded in June, from the almost two years low posted in April, according to the latest Construction PMI reading, up to 58.1. Ah the same time, the Nationwide Housing Prices report for June, showed that the annual pace of house prices slowed in June, moderating to 3.3% from 4.6% in May. Lower prices are positive for the GBP as the BOE has been fearing a housing bubble due to the strong surge in price over the last two years. The GBP/USD pair fell down to 1.5561 a fresh 2-week low, from where it bounced up to 1.5639, before settling right around the 1.5600 level. The technical picture maintains the pair exposed towards the downside, as in the 1 hour chart, the technical indicators stand below their mid-lines, although lacking strength at the time being. In the 4 hours chart, the price remains below a bearish 20 SMA, whilst the Momentum indicator heads lower below their mid-lines, and the RSI indicator consolidates near oversold territory. The pair bounced from the 50% retracement of its latest bullish run, and its 200 EMA in this last time frame, making of the 1.5550/60 region a strong support area that if broken, will signal a downward continuation in the pair towards the 1.5470 region, 61.8% retracement of the same rally.
Support levels: 1.5550 1.5520 1.5170
Resistance levels: 1.5645 1.5695 1.5730
USD/JPY Current price: 123.05
View Live Chart for the USD/JPY
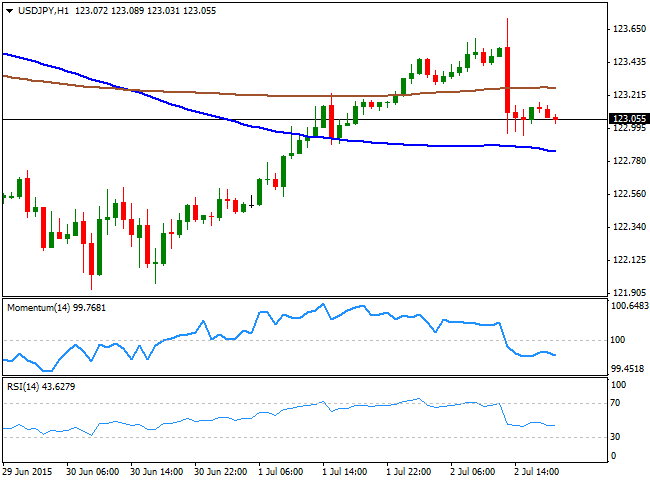
The USD/JPY pair closed the weekly opening gap during the European morning, on hopes a strong US employment report will give the greenback a boost. But the pair retreated down to a daily low of 122.95 as the figures disappointed. Also, the pair came under pressure after stocks turned lower mid American afternoon, closing the day around the 123.00 figure. The 1 hour chart shows that the price held above its 100 SMA that presents a bearish slope around the 122.80 region, providing an immediate intraday support, whilst the technical indicators present bearish slopes in negative territory, supporting additional declines. In the 4 hours chart, the price has returned below its moving averages that converge in the 123.30 region, whilst the technical indicators retreated from their highs and turned flat in positive territory, limiting slides in the short term. The risk remains towards the downside as long as the 123.30 level continues to attract selling interest, with a break below the mentioned 122.80 support, favoring a retest of the weekly low around 122.00.
Support levels: 122.80 122.45 122.00
Resistance levels: 123.30 123.75 124.10
AUD/USD Current price: 0.7624
View Live Chart for the AUD/USD
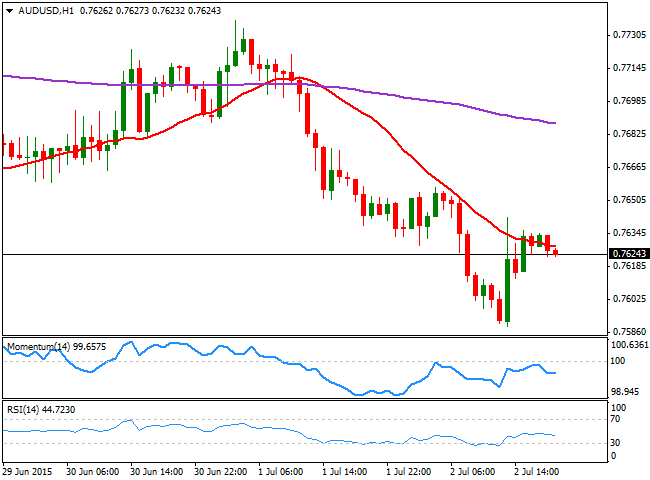
The Australian dollar fell down towards the weekly low against the greenback, reaching 0.7589 before bouncing up to the current 0.7620 region, closing the day in the red, despite weak US employment figures. The Aussie came under pressure after the release of Australia's Trade Balance that came in at -2751M for the month of May, below forecasts of -2200M. Imports fell from previous -2% to -4% in May, while exports were up to 1% in May from previous -2%. Having established a double floor this week around the 0.7580 level, the bias is still bearish, as the price is unable to recover above a strongly bearish 20 SMA, whilst the technical indicators head lower below their mid-lines. In the 4 hours chart, the recovery stalled far below a bearish 20 SMA, whilst the technical indicators have resumed their declines in negative territory, with the RSI indicator approaching oversold levels.
Support levels: 0.7580 0.7550 0.7520
Resistance levels: 0.7640 0.7670 0.7720
Recommended Content
Editors’ Picks
EUR/USD holds firm above 1.0700 ahead of German inflation data

EUR/USD trades on a firm footing above 1.0700 early Monday. The pair stays underpinned by a softer US Dollar, courtesy of the USD/JPY sell-off and a risk-friendly market environment. Germany's inflation data is next in focus.
USD/JPY recovers after testing 155.00 on likely Japanese intervention

USD/JPY is recovering ground after crashing to 155.00 on what seemed like a Japanese FX intervention. The Yen tumbled in early trades amid news that Japan's PM lost 3 key seats in the by-election. Holiday-thinned trading exaggerates the USD/JPY price action.
Gold price bulls move to the sidelines as focus shifts to the crucial FOMC policy meeting

Gold price (XAU/USD) struggles to capitalize on its modest gains registered over the past two trading days and edges lower on the first day of a new week, albeit the downside remains cushioned.
Ripple CTO shares take on ETHgate controversy, XRP holders await SEC opposition brief filing

Ripple loses all gains from the past seven days, trading at $0.50 early on Monday. XRP holders have their eyes peeled for the Securities and Exchange Commission filing of opposition brief to Ripple’s motion to strike expert testimony.
Week ahead: FOMC and jobs data in sight

May kicks off with the Federal Open Market Committee meeting and will be one to watch, scheduled to make the airwaves on Wednesday. It’s pretty much a sealed deal for a no-change decision at this week’s meeting.
