EUR/USD Current price: 1.0876
View Live Chart for the EUR/USD
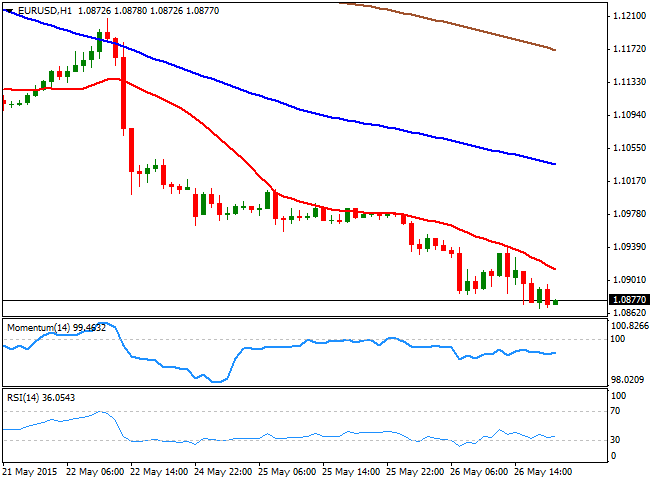
The American dollar outperformed all of its major rivals this Tuesday, with the EUR/USD pair falling at its lowest level for the month near the 1.0880 level, and closing the day around it. There were no fundamental releases in Europe, although tension over a Greece default arose, as following the weekend statement from local authorities, EU Commission's Junker said that the Athens must find a way to pay the IMF by June 5th, establishing a deadline. Additionally, the macroeconomic calendar was pretty busy in the US, with Durable Goods Orders climbing for a second month in a row in April, albeit below expected. The Markit Services PMI for May resulted at 56.4, below expected and the previous reading, but New Home Sales rose in April above expected, and US Consumer Confidence ticked higher to 95.4. The market needed little excuses to keep on buying the greenback, as data was generally positive, but far from up beating, and the USD rallied anyway.
Technically, the 1 hour chart shows that the price consolidates around its daily low, and below a bearish 20 SMA, whilst the technical indicators remain well into negative territory, albeit showing no directional strength. In the 4 hours chart the price has extended further below its moving averages, with the 20 SMA crossing towards the downside the 100 SMA in the 1.1030 region. In the same chart, the Momentum indicator aims higher below its mid-line, whilst the RSI continues to head lower, despite being around 26. As long as below the 1.0910 level, the downside is favored towards the 1.0800 level for this Wednesday.
Support levels: 1.0870 1.0830 1.0800
Resistance levels: 1.0910 1.0950 1.1000
EUR/JPY Current price: 133.81
View Live Chart for the EUR/JPY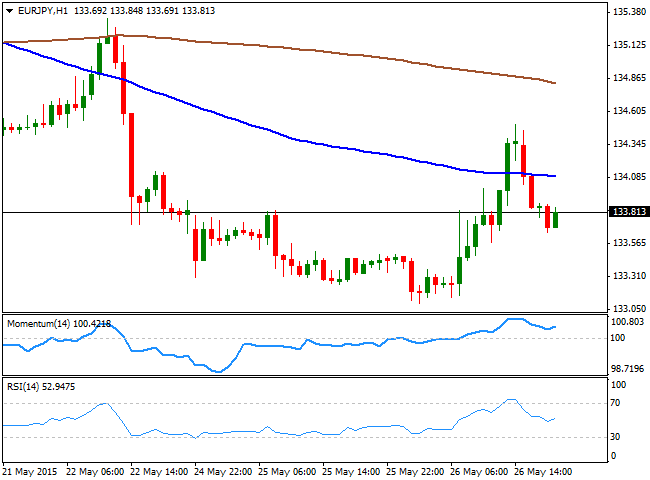
The Japanese Yen weakened sharply across the board, helping the EUR/JPY cross reach a daily high of 134.50 early in the US session, albeit self EUR weakness sent the pair back below the 134.00 figure. With both currencies weak, the pair may remain range bound during the upcoming sessions, with choppy intraday ranges. Technically, the 1 hour chart shows that the price is back below its 100 SMA, currently acting as the immediate short term resistance around 134.10, whilst the Momentum indicator turned higher in positive territory after erasing overbought readings, and the RSI indicator also heads north, having bounced from the 50 level. In the 4 hours chart however, the technical indicators remain below their mid-lines, suggesting bullish rallies will remain limited, and most likely attract selling interest.
Support levels: 133.60 132.10 132.60
Resistance levels: 134.10 134.50 135.00
GBP/USD Current price: 1.5387
View Live Chart for the GBP/USD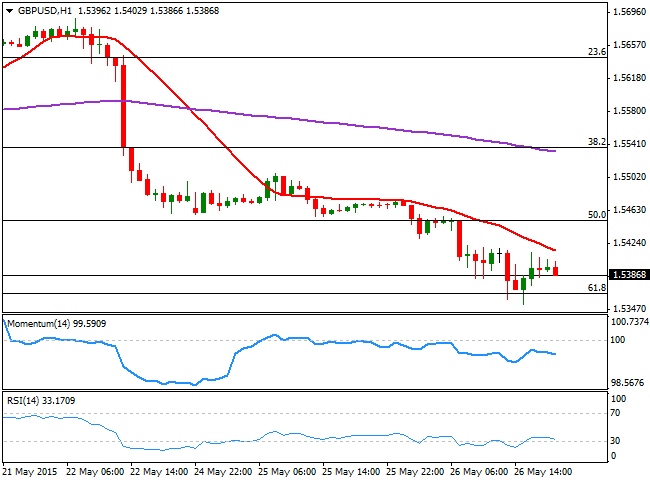
The British Pound fell to a fresh 3-week low against the greenback, with the pair briefly falling below 1.5360, the 61.8% retracement of the latest daily bullish run, before recovering some ground, but overall maintaining a short term bearish bias, as the price was unable to recover above former lows in the 1.5440 region, the 50% retracement of the same rally. The expectations for Retail Sales in the UK for next month stand at their highest for 27 years according to the CBI's latest quarterly survey, which prevented a sharper intraday decline in the GBP/USD pair. Technically, the 1 hour chart shows that the price remains below a bearish 20 SMA, while the technical indicators are turning lower below their mid-lines after a limited upward correction. In the 4 hours chart the price stalled right at its 200 EMA at 1.5353 usually a strong dynamic support, whilst the 20 SMA gained bearish slope above the current price. The technical indicators however, have lost their downward strength and point for a limited upward corrective movement near oversold levels. Nevertheless, as long as the price holds below the mentioned 1.5440 level, the downside is favored towards the 1.5260 level.
Support levels: 1.5360 1.5320 1.5260
Resistance levels: 1.5400 15440 1.5495
USD/JPY Current price: 123.05
View Live Chart for the USD/JPY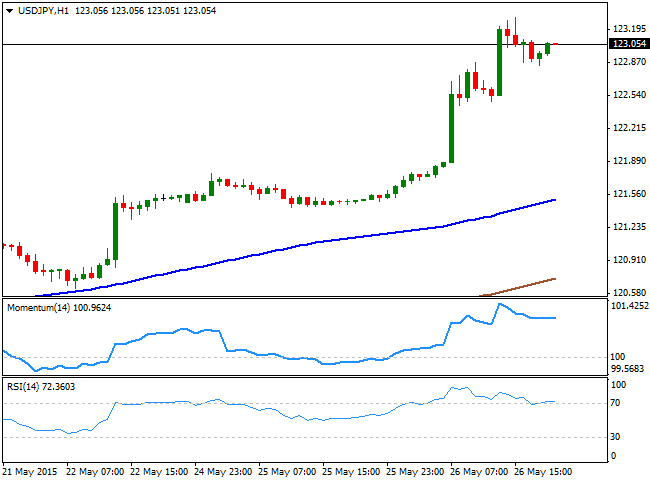
The USD/JPY pair soared to a fresh 8-year high, extending up to 123.31 on the back of dollar's strength, consolidating above the 123.00 level for most of the American afternoon. The pair has spent over two months consolidating in quite a limited 300 pips range, before US inflation data released last Friday, finally triggered a breakout higher. From a technical point of view, the bias is higher, as the 1 hour chart shows that the price has advanced well above its 100 and 200 SMAs, whilst the technical indicators are returning north after a partial correction of extreme overbought readings. In the 4 hours chart the RSI indicator stands at 84, while the Momentum indicator has partially retraced from extreme overbought readings, but both are far from suggesting an upcoming downward corrective movement. Should the price extend above the mentioned daily high, additional gains are to be expected with the market now looking for the critical 125.00 level as the next probable bullish target.
Support levels: 122.70 122.30 121.90
Resistance levels: 123.30 123.65 124.00
AUD/USD Current price: 0.7728
View Live Chart for the AUD/USD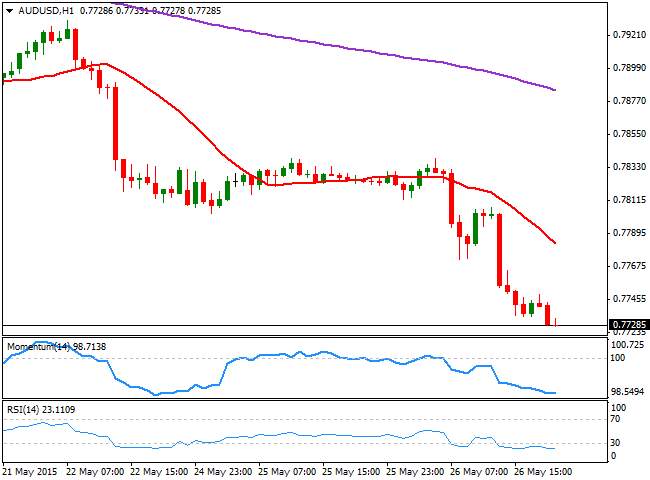
The AUD/USD pair trades at its lowest level in five weeks in the 0.7720 region, having steadily decline ever since the European opening on sustained dollar demand. The strong dollar rally was rather supported by markets' sentiment rather than up beating American data, as investors continue to price in a soon to come rate hike in the US. The AUD/USD pair is overextended in the short term, but the 1 hour chart is far from suggesting the pair is exhausted to the downside, as the price remains near its daily lows whilst the technical indicators maintain their bearish slopes, despite being in oversold territory. In the 4 hours chart, the 20 SMA heads south in the 0.7810 region, whilst the price extended sharply below its 200 EMA, anticipating a midterm decline. In this last time frame, the technical indicators have turned flat in oversold levels, suggesting a pause before a new leg lower.
Support levels: 0.7710 0.7670 0.7635
Resistance levels: 0.7770 0.7810 0.7845
Recommended Content
Editors’ Picks
EUR/USD holds above 1.0700 after US data

EUR/USD struggles to build on Wednesday's gains and fluctuates in a tight channel near 1.0700 on Thursday. The data from the US showed that weekly Jobless Claims held steady at 208,000, helping the USD hold its ground and limiting the pair's upside.
GBP/USD fluctuates above 1.2500 following Wednesday's rebound

GBP/USD stays in a consolidation phase slightly above 1.2500 on Thursday after closing in the green on Wednesday. A mixed market mood caps the GBP/USD upside after Unit Labor Costs and weekly Jobless Claims data from the US.
Gold retreats to $2,300 despite falling US yields

Gold stays under bearish pressure and trades deep in negative territory at around $2,300 on Thursday. The benchmark 10-year US Treasury bond edges lower following the Fed's policy decisions but XAU/USD struggles to find a foothold.
Top 3 Price Prediction BTC, ETH, XRP: Altcoins to pump once BTC bottoms out, slow grind up for now

Bitcoin reclaiming above $59,200 would hint that BTC has already bottomed out, setting the tone for a run north. Ethereum holding above $2,900 keeps a bullish reversal pattern viable despite falling momentum. Ripple coils up for a move north as XRP bulls defend $0.5000.
Happy Apple day

Apple is due to report Q1 results today after the bell. Expectations are soft given that Apple’s Chinese business got a major hit in Q1 as competitors increased their market share against the giant Apple.