EUR/USD Current price: 1.1120
View Live Chart for the EUR/USD

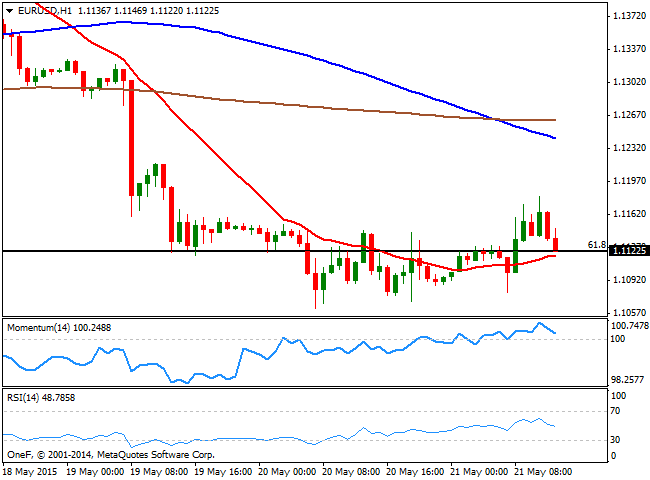
The EUR/USD pair surged to a 2-day high of 1.1180 as investors digests FOMC Minutes released late Wednesday. The FED's statement has diminished chances for a rate hike in June, something the market had already priced in, and at the same time, upgraded the economic outlook in the midterm, which may suggest rates may remain low for longer. Data in Europe was mixed, with German Markit PMIs missing expectations, albeit manufacturing in the EU rose more than expected. In the US, weekly unemployment claims for the week ending May 15th, came out at 274K slightly worse than expected, keeping the greenback in selling mode. Technically, the short term picture supports the downside, with the pair pressuring the 1.1120 region and a mild bullish 20 SMA, whilst the technical indicators have accelerated south below their mid-lines. In the 4 hours chart , the technical indicators turned back south below their mid-lines after correcting oversold readings, keeping the risk towards the downside should the price finally break below the current support.
Support levels: 1.1120 1.1050 1.1000
Resistance levels: 1.1170 1.1220 1.1250
GBP/USD Current price: 1.5679
View Live Chart for the GBP/USD
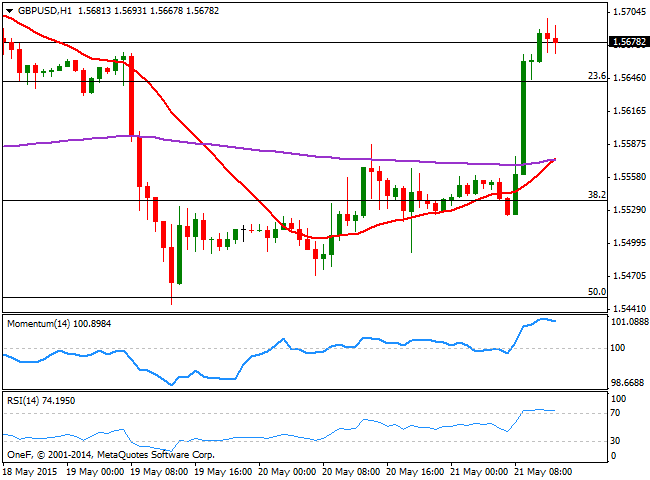
The British Pound resume its bullish trend following the release of better-than-expected UK Retail Sales for May that send the pair sharply higher, up to 1.5699. Having advanced over 150 pips in the day, the pair is now consolidating near the high, and the 1 hour chart shows that the technical indicators are turning lower in extreme overbought territory, not yet signaling a downward correction. In the 4 hours chart, the latest candle opened above the 20 SMA and the 23.6% retracement of the latest daily bullish run, whilst the technical indicators are losing their upward strength around their mid-lines. Nevertheless, as long as above 1.5640 the upside is favored towards the year high set earlier this month at 1.5814.
Support levels: 1.5640 1.5600 1.5550
Resistance levels: 1.5700 1.5735 1.5780
USD/JPY Current price: 121.15
View Live Chart for the USD/JPY
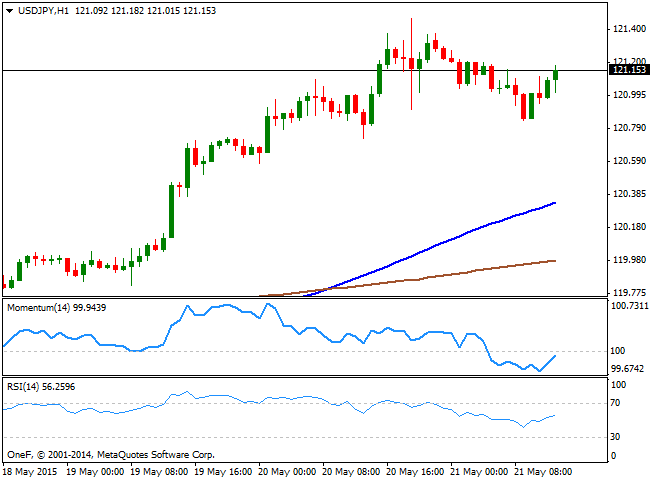
The USD/JPY pair holds ground above the 121.00 level, after an early dip down to 120.84. The dollar advances ahead of the US opening despite tepid employment figures, suggesting there's room for further gains beyond the weekly high set at 121.46. Technically, the 1 hour chart shows that the price stands well above its moving averages, with the 100 SMA breaking above the 200 SMA as the technical indicators head higher around their mid-lines. In the 4 hours chart the technical indicators are regaining the upside after correcting partially extreme overbought readings, supporting the shorter term view.
Support levels: 120.85 120.45 120.10
Resistance levels: 121.45 121.70 122.10
Recommended Content
Editors’ Picks
EUR/USD declines below 1.0700 as USD recovery continues

EUR/USD lost its traction and declined below 1.0700 after spending the first half of the day in a tight channel. The US Dollar extends its recovery following the strong Unit Labor Costs data and weighs on the pair ahead of Friday's jobs report.
GBP/USD struggles to hold above 1.2500

GBP/USD turned south and dropped below 1.2500 in the American session on Thursday. The US Dollar continues to push higher following the Fed-inspired decline on Wednesday and doesn't allow the pair to regain its traction.
Gold stuck around $2,300 as market players lack directional conviction

Gold extended its daily slide and dropped below $2,290 in the second half of the day on Thursday. The benchmark 10-year US Treasury bond yield erased its daily losses after US data, causing XAU/USD to stretch lower ahead of Friday's US jobs data.
Top 3 Price Prediction BTC, ETH, XRP: Altcoins to pump once BTC bottoms out, slow grind up for now

Bitcoin reclaiming above $59,200 would hint that BTC has already bottomed out, setting the tone for a run north. Ethereum holding above $2,900 keeps a bullish reversal pattern viable despite falling momentum. Ripple coils up for a move north as XRP bulls defend $0.5000.
Happy Apple day

Apple is due to report Q1 results today after the bell. Expectations are soft given that Apple’s Chinese business got a major hit in Q1 as competitors increased their market share against the giant Apple.