EUR/USD Current price: 1.0625
View Live Chart for the EUR/USD
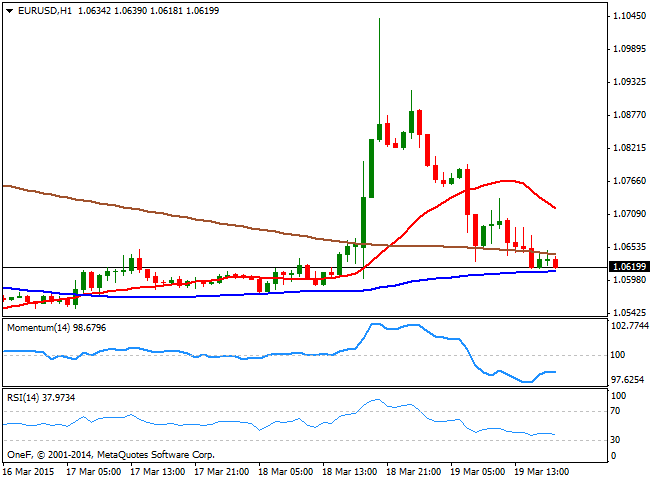
The market spent this Thursday digesting the fact that the FED removed the world "patient", but decided to remain patient anyway, and finally realized that, despite the not that clear announcement, the dollar is still the king. As commented several times during the last few months, the fact remains to be that the US is the only of the major economies, in the path of tightening its economic policy, and a rate hike is in the table whether if in June, or even September. After rallying as high as 1.1041, the EUR/USD pair is down on the day, consolidating a few pips above the daily low of 1.0617. At the fundamental front, the most relevant data of the day came from the US where the weekly unemployment claims that ticked higher last week, up to 291K and, the Philadelphia manufacturing survey also worse-than-expected, down to 45.0 in March from previous month 5.2. Anyway, data were ignored as the greenback advanced all through the day.
From a technical point of view, the EUR/USD 1 hour chart shows that the price break back below its 20 SMA that now heads strongly south above the current price, whilst its finding support at its 100 SMA, around the 1.0610. The indicators in the mentioned time frame have resumed their slide after a partial upward corrective movement. In the 4 hours chart the latest candle opened below its 20 SMA, whilst the technical indicators are now flat around their mid-lines, having made a strong comeback from extreme overbought territory. The immediate support stands at 1.0590, with a break below it most likely favoring a downward continuation towards 1.0550, the next strong static support level.
Support levels: 1.0590 1.0550 1.0510
Resistance levels: 1.0645 1.0680 1.0725
EUR/JPY Current price: 128.50
View Live Chart for the EUR/JPY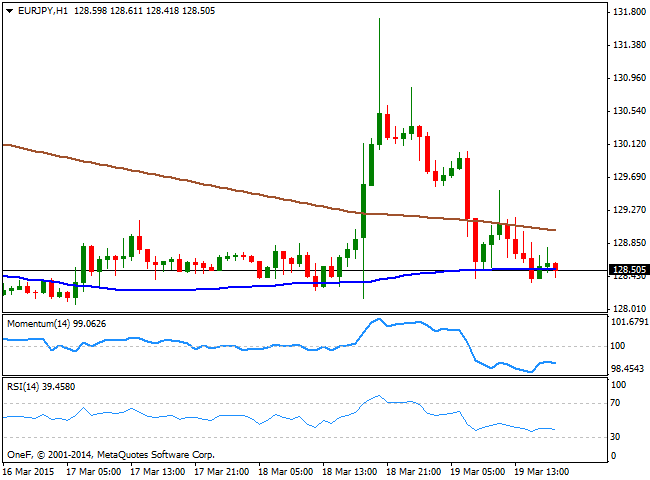
The Japanese yen regained all the upside in the crosses, but fell against the greenback, as dollar strength led the way this Thursday. The most relevant fundamental data ahead will be the Bank of Japan releasing the Minutes of its latest meeting during the upcoming Asian session, although no surprises are expected from there. In the meantime, the EUR/JPY pair trades near its daily low of 128.35, and the 1 hour chart shows that the bias is lower, as the price pressures a flat 100 SMA, whilst the technical indicators head lower near oversold territory. In the 4 hours chart the price failed on Wednesday to extend above a strongly bearish 100 SMA, while at the time being, the technical indicators are turning flat below their mid-lines, supporting additional declines should the price break below 128.10, the immediate support.
Support levels: 128.10 127.60 127.15
Resistance levels: 128.70 129.20 129.55
GBP/USD Current price: 1.4691
View Live Chart for the GBP/USD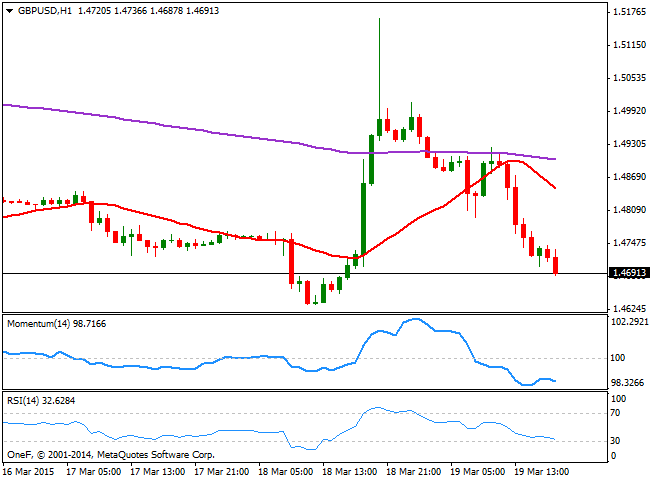
The GBP/USD pair eased down to 1.4687, ending the day with a bearish engulfing pattern that points for fresh year lows in the pair, during the upcoming days. There has been no relevant data in the UK, and on Friday, the UK will release the Public Sector Net Borrowing figures for February, but the reading can hardly affect the ongoing bearish trend. In the short term, the 1 hour chart shows that the price struggles around the 1.4700 level, with the 20 SMA heading strongly south well above the current price, as the Momentum indicator heads lower after a limited upward corrective movement, and the RSI indicator maintains a strong bearish slope around 33, supporting some further declines. In the 4 hours chart the price stands below a mild bearish 20 SMA, while the Momentum indicator aims higher below the 100 level and the RSI lacks directional strength around 41, also supporting additional declines in the short term.
Support levels: 1.4680 1.4635 1.4590
Resistance levels: 1.4720 1.4760 1.4800
USD/JPY Current price: 120.97
View Live Chart for the USD/JPY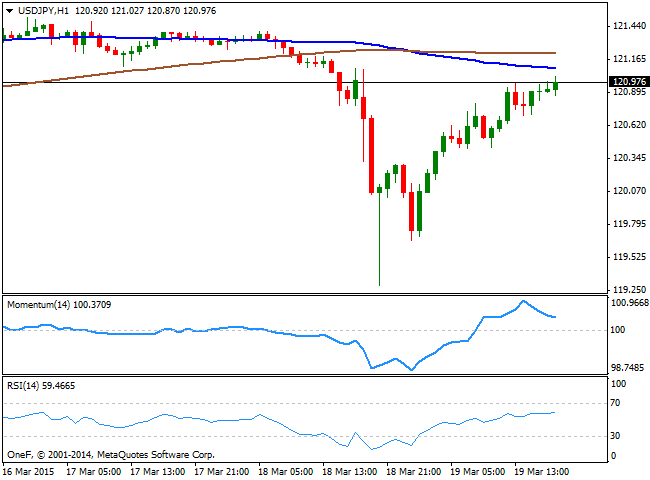
The USD/JPY pair flirted with the 121.00 level late in the US afternoon, having recovered sharply from the 119.26 posted last Wednesday. The technical picture shows the upward potential is losing strength, as the price remains below the 100 and 200 SMAs, both in the 121.20/30 region, whilst the Momentum indicators turned lower well above the 100 level and the RSI indicator stands flat around 58. In the 4 hours chart, the price advances well above the 100 SMA that maintains a strong bullish slope around 120.50, whilst the technical indicators continue advancing, but remain below their mid-lines. An upward continuation above the 121.20 level may lead to further gains towards the 121.50/60 area, where the pair has quite a congestion zone that needs to clear out to confirm fresh highs for the year.
Support levels: 120.80 120.50 120.00
Resistance levels: 121.20 121.65 122.02
AUD/USD Current price: 0.7623
View Live Chart for the AUD/USD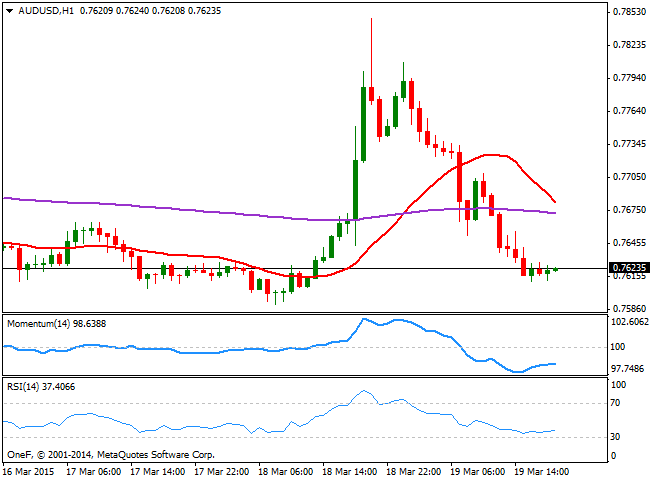
The Australian dollar fell down to 0.7611 against the greenback, consolidating near the lows of the day. During the upcoming hours, RBA Governor Glenn Stevens is scheduled to speak at the American Chamber of Commerce in Australia luncheon, in Melbourne, and the market will be looking for any clues on upcoming economic policy moves. In the meantime, the technical picture favors the downside in the short term, as in the 1 hour chart, the price holds steady near the daily low and well below its 20 SMA, whilst the technical indicators are consolidating near oversold levels. In the 4 hours chart the bearish momentum has lost strength, as after crossing their mid-lines, the technical indicators are now turning flat, whilst the 20 SMA offers intraday resistance in the 0.7655 price zone. Wednesday low at 0.7590 is not the critical support as a break below it should lead to a continued decline towards this year low around 0.7555 in the short term.
Support levels: 0.7590 0.7555 0.7520
Resistance levels: 0.7660 0.7695 0.7740
Recommended Content
Editors’ Picks
EUR/USD retreats to 1.0700 after US data

EUR/USD lost its traction and turned negative on the day near 1.0700 in the American session on Tuesday. The data from the US showed that Employment Cost Index rose more than expected in Q1 and provided a boost to the USD.
GBP/USD declines toward 1.2500 on renewed USD strength

GBP/USD turned south and dropped toward 1.2500 in the second half of the day. The US Dollar gathers strength following the strong wage inflation data, forcing the pair to stay on the back foot.
Gold extends daily slide toward $2,300 after US data

Gold stays under bearish pressure and declines toward $2,300 on Tuesday. The benchmark 10-year US Treasury bond yield stays in positive territory above 4.6% after US Employment Cost Index data, weighing on XAU/USD.
XRP hovers above $0.51 as Ripple motion to strike new expert materials receives SEC response

Ripple (XRP) trades broadly sideways on Tuesday after closing above $0.51 on Monday as the payment firm’s legal battle against the US Securities and Exchange Commission (SEC) persists.
Eurozone inflation stable as the outlook on prices gets increasingly muddied

Eurozone headline inflation remains stable at 2.4%. With higher energy prices and improving domestic demand, questions about the direction of inflation become louder.