EUR/USD Current price: 1.1019
View Live Chart for the EUR/USD
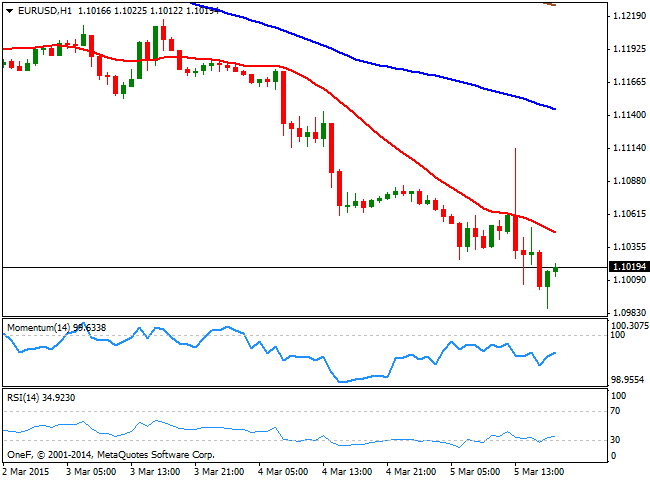
The EUR/USD pair has slid temporally below the 1.1000 level this Thursday, following the ECB latest monetary policy meeting. As suspected, the Central Bank will start as soon as next Monday, March 9, to buy public sector bonds in the secondary market, while it will also continue its buying of ABS and covered bonds. As an exception, the ECB will not buy bond with yields below the deposit rate, and because of the obvious reasons, it won't be buying Greek bonds. The surprise in Mr. Draghi's speech came from a strong upward review in GDP and inflation projections for the next three years, and from the fact that the Governing Council believes the euro area is already showing signs of improvement. The market's initial reaction to these words came in the form of a spike up to 1.1113 that was quickly reversed. The pair fell slowly but steady down to 1.0986, levels not seen since September 2003, before bouncing back above the 1.1000 level.
Technically however, the short term picture continues to favor the downside, as the 1 hour chart shows that the price develops below its 20 SMA and that the technical indicators remain in negative territory, with the RSI barely bouncing from oversold levels. In the 4 hours chart, the 20 SMA extended lower, now offering dynamic resistance around the 1.1130 price zone, whilst the Momentum indicator stands directionless below 100 and the RSI maintains its bearish slope around 23. The market will likely remain on hold during the upcoming Asian session, waiting for US employment figures, to be released early Friday, before making next move.
Support levels: 1.1000 1.0960 1.0920
Resistance levels: 1.1050 1.1100 1.1145
EUR/JPY Current price: 132.37
View Live Chart for the EUR/JPY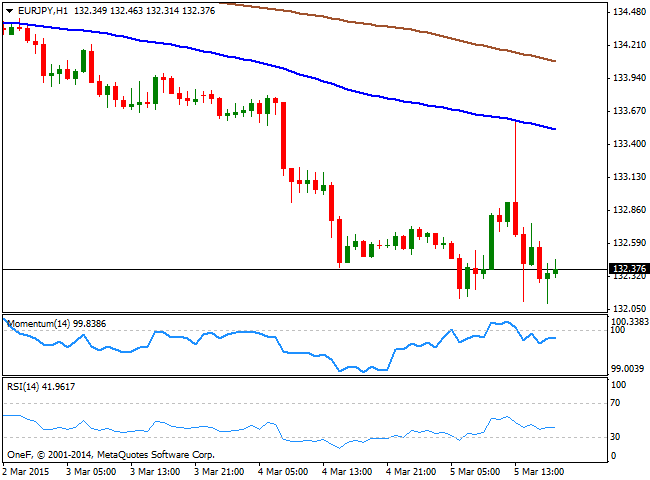
The Japanese yen weakened ahead of the ECB announcement, with the EUR/JPY rising up to 133.58 afterwards. Nevertheless, the pair ended the day with some limited losses and the 1 hour chart shows that the pair retreated by the pip from its 100 SMA, currently at 133.50. In the same chart, the technical indicators stand directionless below their mid-lines, while the 4 hours chart shows that a more constructive downward potential, as the price remains well below its moving averages, and the RSI heads lower around 31 after a limited corrective movement from oversold levels. The pair has established a daily low at 132.10, which means a price acceleration below the level should lead to a steadier decline towards the 130.13 level, January 25 daily low.
Support levels: 132.10 131.70 131.25
Resistance levels: 132.85 133.25 133.50
GBP/USD Current price: 1.5240
View Live Chart for the GBP/USD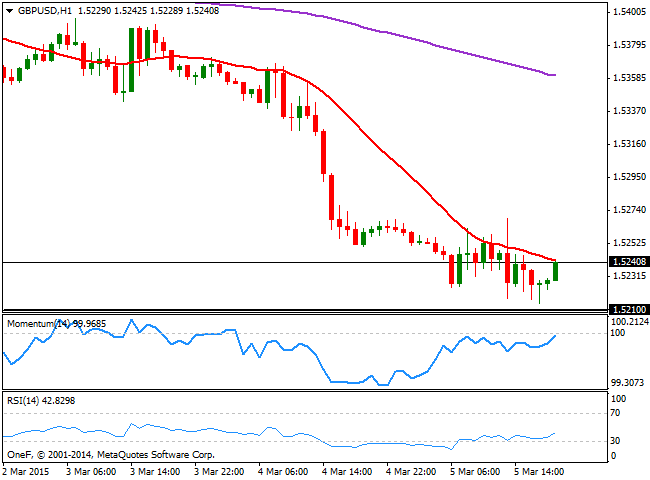
The GBP/USD pair fell down to 1.5214 on the back of dollar strength after the ECB decision, with the pair posting a short lived spike up to 1.5269, the daily high. Earlier during the European morning, the Bank of England had its monthly economic policy meeting, but it became a non-event as the MPC decided to leave rates and the APP unchanged. From a technical point of view, the 1 hour chart supports some upward correction, as the price pressures a flat 20 SMA, while the Momentum indicator aims to cross the 100 level to the upside, and the RSI bounced from oversold territory. In the 4 hours chart however, the picture is not that clear, as the 20 SMA crossed below the 200 EMA, both well above the current level, whilst the technical indicators are turning slightly higher from extreme oversold levels, more reflecting exhaustion than favoring an upward recovery. A steady advance beyond 1.5270 is required to see the pair extending its upward move, eyeing an advance up to the 1.5340/50 price zone.
Support levels: 1.5210 1.5180 1.5135
Resistance levels: 1.5270 1.5310 1.5345
USD/JPY Current price: 120.11
View Live Chart for the USD/JPY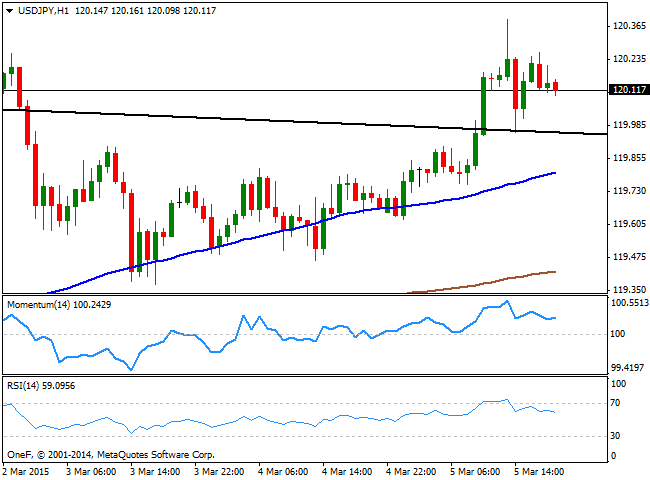
The USD/JPY pair rose to a fresh monthly high of 120.39 ahead of the ECB, and despite US weekly unemployment claims in the US rose to 320,000 in the week ending February 27, far above the expectations of 295,000. The pair broke above a daily descendant trend line coming from last year high at 121.84, currently around 119.90, and even completed a pullback to it before posting a limited bounce, trading steady above the 120.00 figure, late in the US session. The 1 hour chart shows that the 100 and the 200 SMAs, maintain their strong bullish slopes well below the current price, although the technical indicators have lost upward potential, and head south above their mid-lines. In the 4 hours chart the technical indicators also turned lower above their mid-lines, but the price holding above the 120.00 denies the possibility of a stronger decline in the short term.
Support levels: 119.90 119.40 119.10
Resistance levels: 120.45 120.90 121.35
AUD/USD Current price: 0.7773
View Live Chart for the AUD/USD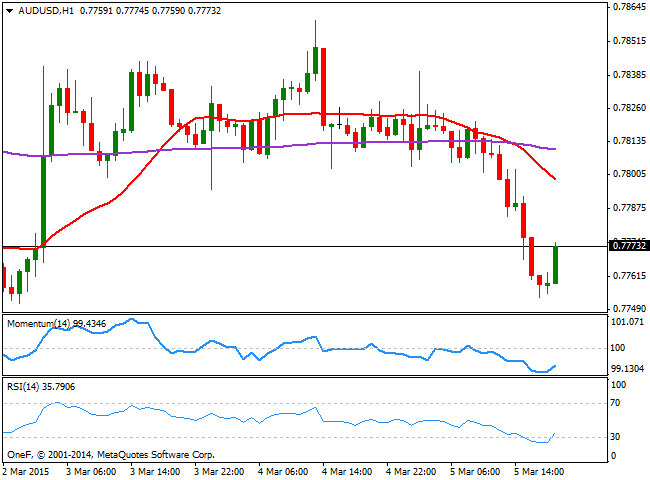
The Australian dollar slipped down to 0.7753 against the American dollar, unable to sustain gains above the 0.7800 figure. The market speculates that the RBA will cut rates some time during the upcoming meetings, regardless the Central Bank decided to stay on hold earlier this week, weighing on the antipodean currency. The 1 hour chart shows that the price develops well below its 20 SMA that accelerates lower, while the technical indicators are bouncing from oversold levels, supporting a short term upward correction towards the critical figure. In the 4 hours chart the price stands below a bearish 20 SMA while the indicators are flat below their mid-lines, giving little directional clues at the time being. During the upcoming hours, Australia will release its AIG Performance of Construction Index for February, latest at 45.9. A reading closer or above 50, may give the Aussie some short term support, although movements are expected to remain limited all across the board ahead of Friday's US NFP readings.
Support levels: 0.7755 0.7720 0.7690
Resistance levels: 0 .7800 0.7840 0.7890
Recommended Content
Editors’ Picks
EUR/USD holds firm above 1.0700 ahead of German inflation data

EUR/USD trades on a firm footing above 1.0700 early Monday. The pair stays underpinned by a softer US Dollar, courtesy of the USD/JPY sell-off and a risk-friendly market environment. Germany's inflation data is next in focus.
USD/JPY recovers after testing 155.00 on likely Japanese intervention

USD/JPY is recovering ground after crashing to 155.00 on what seemed like a Japanese FX intervention. The Yen tumbled in early trades amid news that Japan's PM lost 3 key seats in the by-election. Holiday-thinned trading exaggerates the USD/JPY price action.
Gold price bulls move to the sidelines as focus shifts to the crucial FOMC policy meeting

Gold price struggles to capitalize on its modest gains registered over the past two trading days and edges lower on the first day of a new week, albeit the downside remains cushioned.
Ripple CTO shares take on ETHgate controversy, XRP holders await SEC opposition brief filing

Ripple loses all gains from the past seven days, trading at $0.50 early on Monday. XRP holders have their eyes peeled for the Securities and Exchange Commission filing of opposition brief to Ripple’s motion to strike expert testimony.
Week ahead: FOMC and jobs data in sight

May kicks off with the Federal Open Market Committee meeting and will be one to watch, scheduled to make the airwaves on Wednesday. It’s pretty much a sealed deal for a no-change decision at this week’s meeting.