EUR/USD Current price: 1.1389
View Live Chart for the EUR/USD

The previous week ended with relief for investors, as the Greek government finally got a deal with its creditors that is, to extend by four months the ongoing bailout program. The country's government however, will have to come up with a list of reforms, and submit it to the Troika if they plan to keep their anti-austerity promises made ahead of the elections. As usual in Europe, problems get delayed, but not solved. In the meantime, the attention will shift towards the US this week, as FED's Yellen is due to testify before the houses. The market will be looking there for some clues on what's next for the country, when it comes to a rate hike. During the last few weeks, the US macroeconomic data has been for the most, disappointing, whilst European number have been slightly encouraging, something that may trigger some short covering upon the upcoming days.
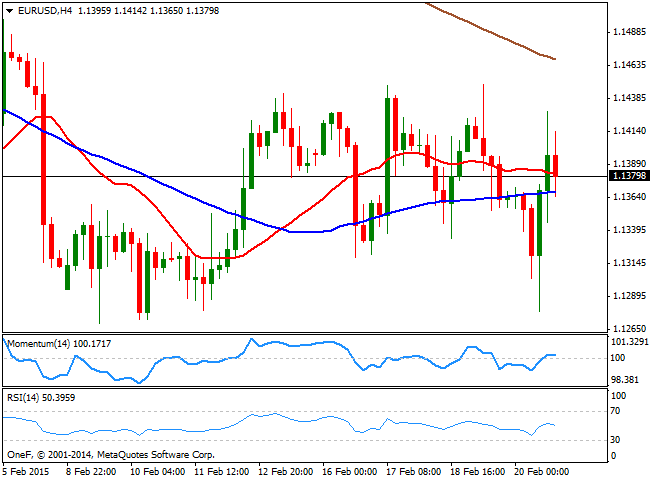
From a technical perspective however, the upside remains limited for the common currency, as the immediate relief-rally stalled below the strong static resistance level around 1.1440, confining the pair to its recent range. The 4 hours chart shows that the price hovers around a horizontal 20 SMA that stands a few pips above the 100 SMA, both signaling the lack of directional strength. The indicators in the mentioned time frame also fail to support a dominant trend, with the Momentum flat above 100 and the RSI heading lower around 10.
Support levels: 1.1340 1.1305 1.1280
Resistance levels: 1.1400 1.1440 1.1485
GBP/USD Current price: 1.5391
View Live Chart for the GBP/USD
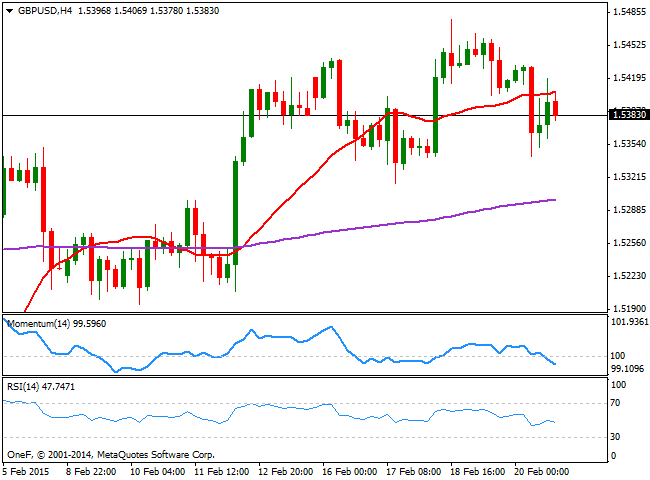
The GBP/USD pair holds to its recent gains, despite having failed to extend its gains last week beyond the 1.5500 level. The sterling has been doing well on its own, supported by strong economic developments. And, during the upcoming days, the economy will release its inflation and GDP figures, which can see the pair finally breaking out higher if the figures overcome expectations. The main risk will come from the CPI as the BOE has warned that inflation may fall below 0.00% sometime this year, blaming the slowdown on weak crude oil prices. Also, if the dollar gets a boost from Yellen, the risk in the pair will turn towards the downside, albeit limited compared to other high yielders. From a technical point of view, the 4 hours chart presents a negative bias, as the price develops below its 20 SMA, currently offering the immediate short term resistance around 1.5410, while the Momentum indicator heads south below 100 and the RSI also presents a bearish slope around 47.
Support levels: 1.5340 1.5300 1.5260
Resistance levels: 1.5420 1.5460 1.5500
USD/JPY Current price: 119.03
View Live Chart for the USD/JPY
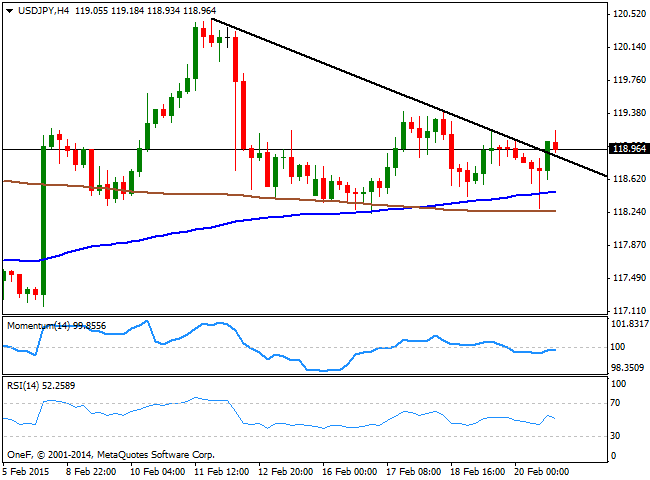
The USD/JPY pair staged a shy recovery during the last week, but run of steam around the 119.00 level, as the pair has been unable to sustain gains above it, despite the strong recovery in worldwide indexes. This week calendar will be pretty light in Japan until Thursday, when the country will release its inflation figures, with the core reading seen slowing amid tumbling oil prices. The number is key, as it has been slowing for several months in a row, far from the BOJ´s target. From a technical point of view, the 4 hours chart shows that the pair closed last week above a short term descendant trend line coming from 120..47, February 11 daily high, but mostly, the price traded within range. In the same time frame the technical indicators present a neutral stance, while the price stands above its 20 SMA, giving some limited support to the pair. At this point, some follow through beyond 119.40 is required to confirm a firmer rally, eyeing a retest of the mentioned monthly high.
Support levels: 118.70 118.25 117.80
Resistance levels: 119.40 119.85 120.40
AUD/USD Current price: 0.7844
View Live Chart for the AUD/USD
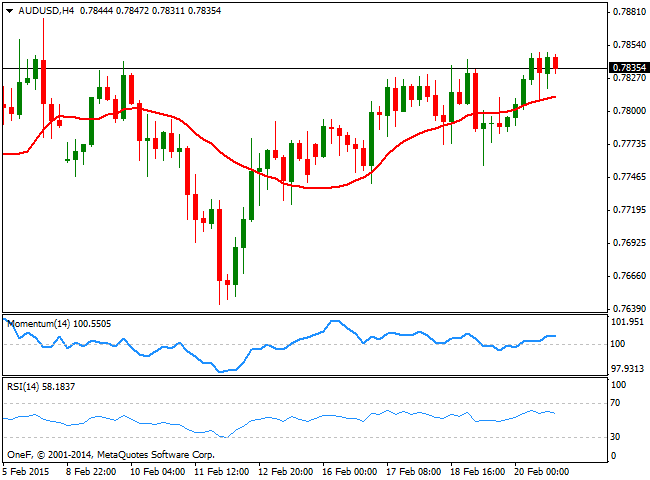
The Australian dollar trades at the higher end of its recent range against the greenback, and surprisingly, last week COT report shows that net-short positions have been reduced partially in most majors, exception made in the Aussie. The 4 hours chart shows that the price has managed to extend above its 20 SMA, and that the moving average has offered short term support on retracements, now around 0.7810. The momentum indicator in the mentioned time frame heads slightly higher above 100, but the RSI turned lower around 58, showing little upward potential ahead of the opening. The pair needs to advance beyond the 0.7850 price zone to be able to extend its gains towards the 0.7890, while a decline below 0.7770 should favor a downward continuation towards the 0.7730 price zone.
Support levels: 0.7810 0.7770 0.7735
Resistance levels: 0.7855 0.7890 0.7925
Recommended Content
Editors’ Picks
EUR/USD declines below 1.0700 as USD recovery continues

EUR/USD lost its traction and declined below 1.0700 after spending the first half of the day in a tight channel. The US Dollar extends its recovery following the strong Unit Labor Costs data and weighs on the pair ahead of Friday's jobs report.
GBP/USD struggles to hold above 1.2500

GBP/USD turned south and dropped below 1.2500 in the American session on Thursday. The US Dollar continues to push higher following the Fed-inspired decline on Wednesday and doesn't allow the pair to regain its traction.
Gold stuck around $2,300 as market players lack directional conviction

Gold extended its daily slide and dropped below $2,290 in the second half of the day on Thursday. The benchmark 10-year US Treasury bond yield erased its daily losses after US data, causing XAU/USD to stretch lower ahead of Friday's US jobs data.
Top 3 Price Prediction BTC, ETH, XRP: Altcoins to pump once BTC bottoms out, slow grind up for now

Bitcoin reclaiming above $59,200 would hint that BTC has already bottomed out, setting the tone for a run north. Ethereum holding above $2,900 keeps a bullish reversal pattern viable despite falling momentum. Ripple coils up for a move north as XRP bulls defend $0.5000.
Happy Apple day

Apple is due to report Q1 results today after the bell. Expectations are soft given that Apple’s Chinese business got a major hit in Q1 as competitors increased their market share against the giant Apple.