EUR/USD Current price: 1.2605
View Live Chart for the EUR/USD
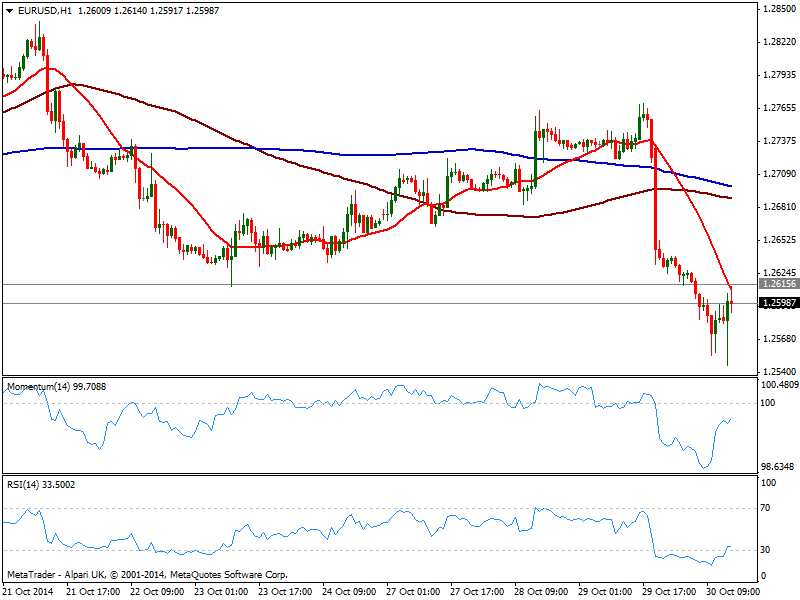
The EUR/USD posted a lower low for the week of 1.2546 on the release of a better than expected US GDP reading, up to 3.5% against the expected 3.0%. The movement however was short lived, as the pair bounced up to 1.2614 with the news, hovering around the 1.2600 with US opening. The movement was for the most corrective as the critical price zone held, probably triggered by some profit taking. Technically, the 1 hour chart shows indicators recovered from extreme oversold levels yet remain in negative territory, while 20 SMA maintains a strong bearish slope, capping the upside around mentioned 1.2614. In the 4 hours chart momentum continues heading south with RSI posting a shy bounce form 30: above 1.2620, the corrective movement can extend up to 1.2660, without affecting the ongoing bearish trend. Renewed selling interest that pushes price below 1.2550 on the other hand, should lead to a test of the year low at 1.2501.
Support levels: 1.2580 1.2550 1.2500
Resistance levels: 1.2620 1.2660 1.2700
GBP/USD Current price: 1.5999
View Live Chart for the GBP/USD
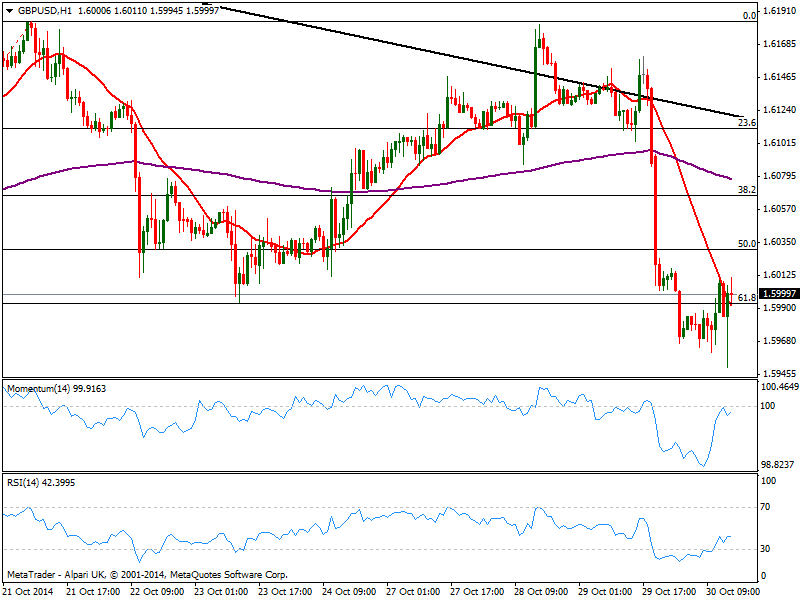
The GBP/USD also bounced back to hold around 1.6000 after posting a lower low for the week of 1.5950. The pair how shows little aims to extend its gains beyond the 1.6010 price zone, and the hourly chart shows price also hovering back and forth around a bearish 20 SMA, while indicators corrected oversold readings but remain below their midlines. In the 4 hours chart indicators are bouncing form oversold levels, and 20 SMA maintains a strong bearish slope above current price. An upward correction is possible, moreover on a break above 1.6030, 50% retracement of the latest bullish run.
Support levels: 1.5995 1.5950 1.5910
Resistance levels: 1.6030 1.6060 1.6090
USD/JPY Current price: 109.03
View Live Chart for the USD/JPY
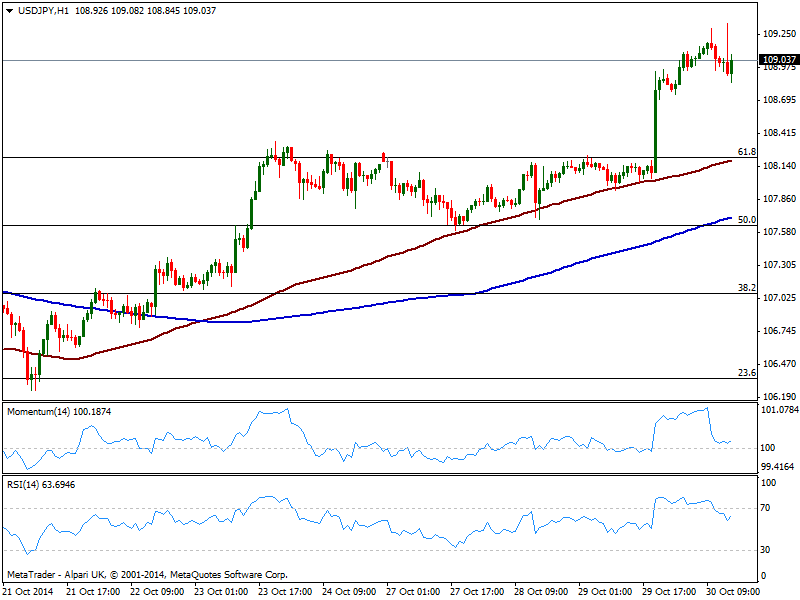
The USD/JPY holds around 109.00, maintaining its bullish tone both short and longer term according to technical readings: the 1 hour chart shows indicators regaining the upside with momentum recovering from its midline, while 100 and 200 SMAs advanced further: the shortest one now converges with a strong Fibonacci support around 108.25. In the 4 hours chart, indicators look exhausted in overbought territory, but remain far from suggesting a bearish correction.
Support levels: 108.70 108.25 107.70
Resistance levels: 109.45 109.90 110.20
Recommended Content
Editors’ Picks
Fed’s Powell said further conviction that inflation is returning to the target is needed before start cutting rates – LIVE

Chair Powell reiterated that the Fed's policy rate remains restrictive, although further confidence that inflation is retreating towards the bank's target is needed before deciding on reducing rates.
EUR/USD extends gains above 1.0700 on Powell’s presser

The selling bias in the Greenback gathers extra pace as Powell’s press conference is under way, lifting EUR/USD to daily tops past the 1.0700 hurdle.
GBP/USD rises above 1.2500 on weaker Dollar

The resumption of the upward pressure sends GBP/USD back above 1.2500 the figure in response to increasing selling pressure hurting the Greenback.
Gold surpasses $2,300 as Dollar tumbles

The precious metal maintains its constructive stance and trespasses the $2,300 region on Wednesday after the Federal Reserve left its FFTR intact, matching market expectations.
A new stage of Bitcoin's decline

Bitcoin's closing price on Tuesday became the lowest since late February, confirming the downward trend and falling under March and April support and the psychologically important round level.