EUR/USD Current price: 1.2610
View Live Chart for the EUR/USD
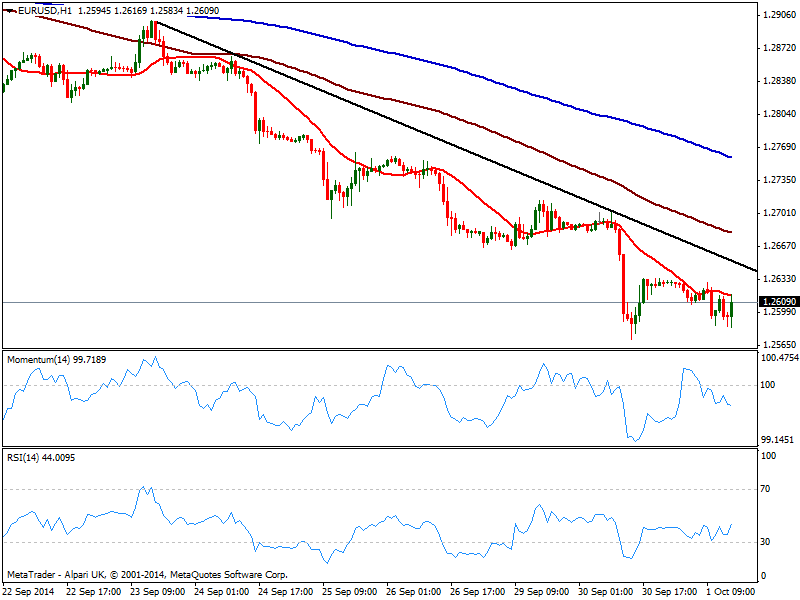
Dollar is under mild pressure across the board, with investors probably taking some profits out of the table ahead of upcoming key readings, and despite a better than expected ADP, up to 213K suggesting a good NFP number for next Friday. In Europe, Manufacturing PMIs resulted negative, with EZ and German ones missing expectations. The EUR/USD fell as low as 1.2581 before regaining the 1.2600 level, with the 1 hour chart now showing price below its 20 SMA and momentum still heading south in negative territory. In the 4 hours chart the bearish tone prevails, albeit RSI aims higher above 30, supporting current upward correction: critical resistance stands around 1.2650, a daily descendant trend line coming from 1.2880 region, and 20 SMA in the 4 hours chart.
Support levels: 1.2570 1.2540 1.2510
Resistance levels: 1.2620 1.2650 1.2690
GBP/USD Current price: 1.6214
View Live Chart for the GBP/USD
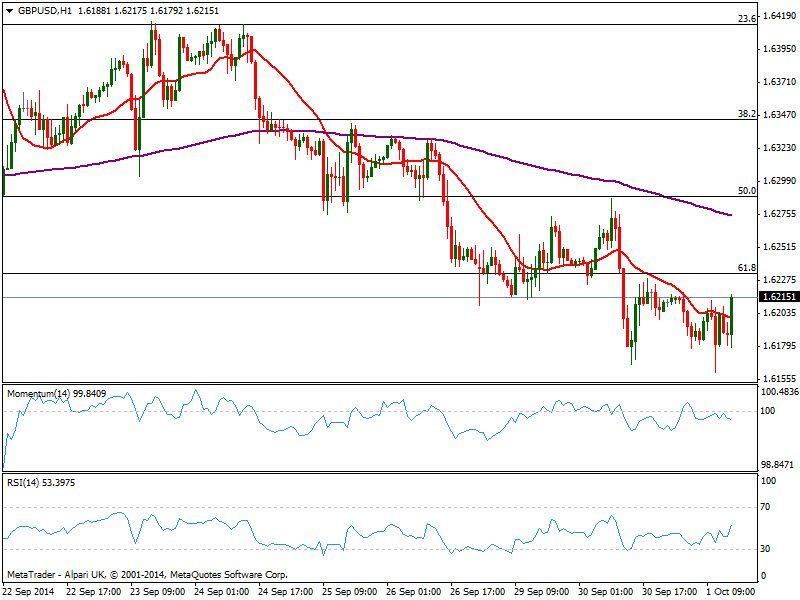
The GBP/USD trades a few pips above its daily opening, having however posted a lower low for the day at 1.6161 on the back of a weak UK Manufacturing PMI readings. The pair however, remains below 1.6230/40 area, and it will take a recovery above it to confirm further intraday gains. In the 1 hour chart, price stands above a flat 20 SMA while indicators aim higher in neutral territory, showing no actual strength. In the 4 hours chart 20 SMA heads lower around mentioned resistance area, also the 61.8% retracement of the latest bullish run, while indicators aim higher still below their midlines, supporting the shorter term view.
Support levels: 1.6160 1.6120 1.6085
Resistance levels: 1.6235 1.6260 1.6290
USD/JPY Current price: 109.58
View Live Chart for the USD/JPY
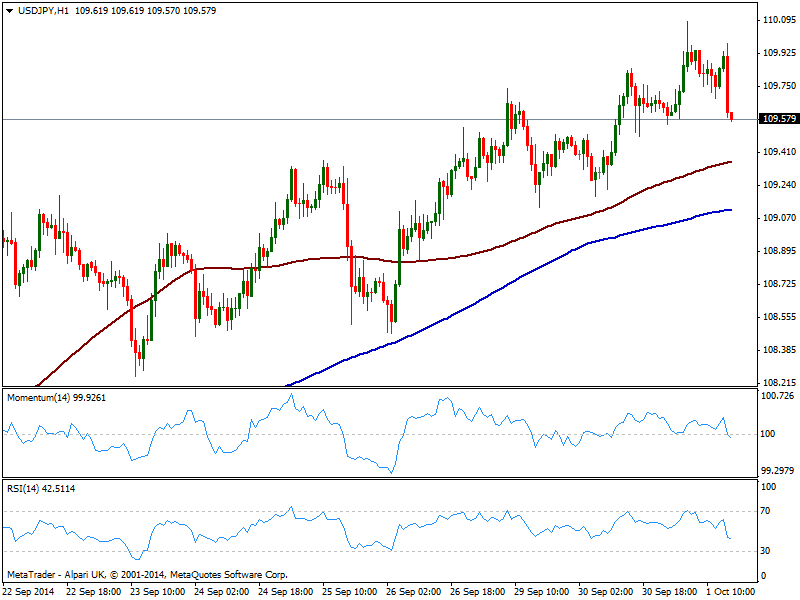
The USD/JPY reached 110.08 from where is now retracing strongly on the back of dollar selling, holding however, well above the 109.00 mark. The 1 hour chart shows price above moving averages, while indicators turned strongly south, currently crossing their midlines to the downside. In the 4 hours chart indicators also turned lower and approach their midlines, with further downward accelerations below 109.45 pointing for an approach to the 109.00 price zone.
Support levels: 109.45 109.15 108.90
Resistance levels: 109.80 110.20 110.50
AUD/USD Current price: 0.8714
View Live Chart of the AUD/USD
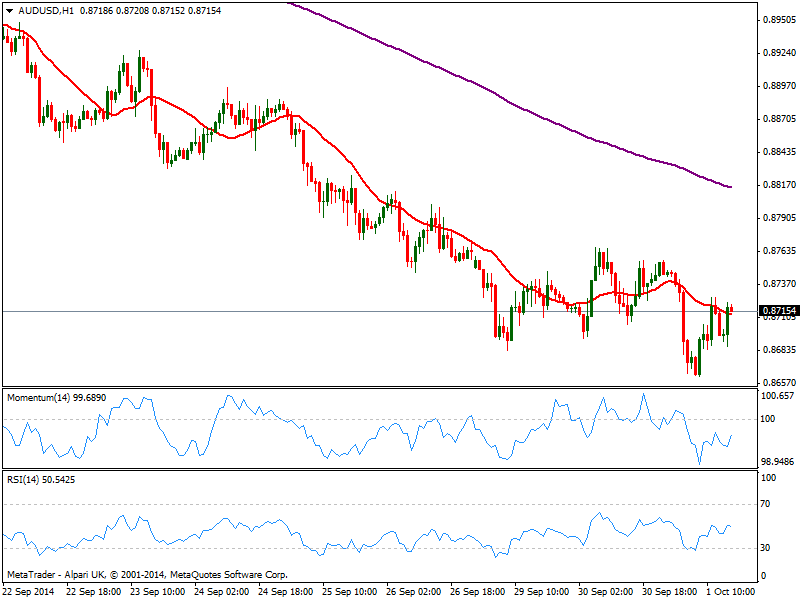
The AUD/USD suffered a kneejerk in Asia, down to 0.8661 on the day, albeit trading now back above 0.8700. The short term picture presents a mild bearish tone, with price hovering around a bearish 20 SMA and indicators in negative territory, showing no directional strength at the time being. In the 4 hours chart indicators stand around their midlines, while 20 SMA heads lower a few pips above current price limiting the upside around 0.8720.
Support levels: 0.8710 0.8680 0.8635
Resistance levels: 0.8720 0.8765 0.8800
Recommended Content
Editors’ Picks
EUR/USD holds above 1.0750 to start the week

EUR/USD trades in positive territory above 1.0750 in the European session on Monday. The US Dollar struggles to find demand following Friday's disappointing labor market data and helps the pair hold its ground.
GBP/USD edges higher toward 1.2600

Following Friday's volatile action, GBP/USD pushes higher toward 1.2600 on Monday. Soft April jobs report from the US and the modest improvement seen in risk mood make it difficult for the US Dollar to gather strength.
Gold rebounds above $2,310 after downbeat NFP data, eyes on Fedspeak

Gold price trades in positive territory above $2,310 after closing the previous week in the red. The weaker-than-expected US employment data have boosted the odds of a September Fed rate cut, hurting the USD and helping XAU/USD find support.
Addressing the crypto investor dilemma: To invest or not? Premium

Bitcoin price trades around $63,000 with no directional bias. The consolidation has pushed crypto investors into a state of uncertainty. Investors can expect a bullish directional bias above $70,000 and a bearish one below $50,000.
Week ahead: BoE and RBA decisions headline a calm week

Bank of England meets on Thursday, unlikely to signal rate cuts. Reserve Bank of Australia could maintain a higher-for-longer stance. Elsewhere, Bank of Japan releases summary of opinions.