EUR/USD Current price: 1.2690
View Live Chart for the EUR/USD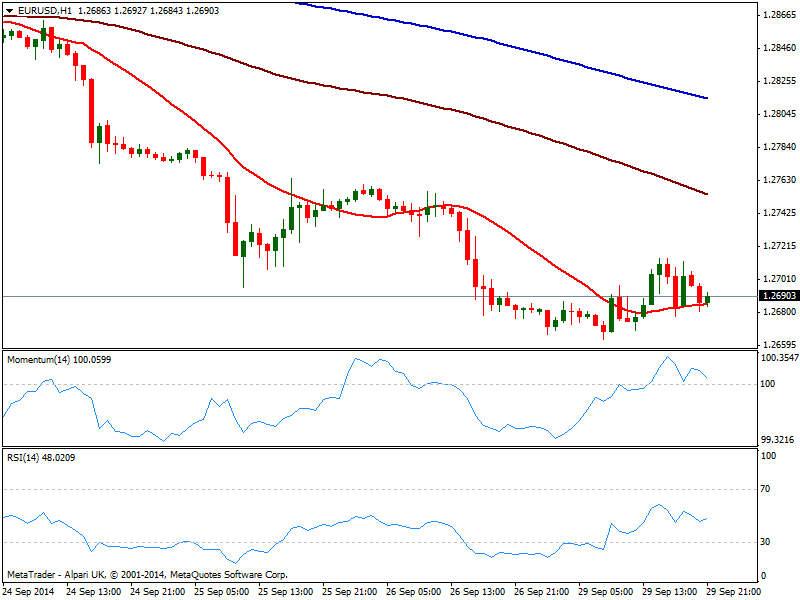
The EUR/USD managed to bounce some 50 pips this Monday, but at least this time, no one screamed “wolf”. The pair found some support in bleeding stocks as US share markets fell below last week low before erasing half their losses and bringing a more quiet US session. But US Index remains near its 4-year high, having trimmed also intraday losses, on the back of US spending and income data for August supporting the view of a steady domestic economic growth. At the end of the day, the market still likes the greenback, albeit ranges prevailed amid upcoming macroeconomic first line data later on the week.
As for the EUR/USD, the pair fell as low as 1.2663 and found sellers at 1.2714 daily high; the 1 hour chart shows price consolidating above a flat 20 SMA but well below 100 and 200 ones, as indicators stand directionless around their midlines. In the 4 hours chart indicators had managed to correct oversold readings but remain in negative territory with RSI turning back south, and 20 SMA maintaining a strong bearish slope above current price. Trend definitions will hardly come on Tuesday, with some extension either side of the mentioned range to be also limited ahead of ECB and US Payrolls later this week.
Support levels: 1.2660 1.2625 1.2590
Resistance levels: 1.2715 1.2740 1.2770
EUR/JPY Current price: 138.86
View Live Chart for the EUR/JPY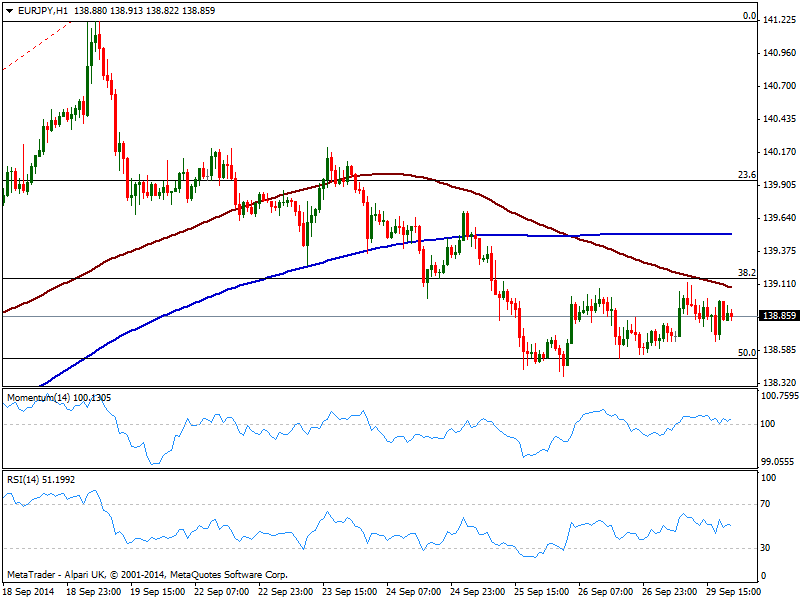
The EUR/JPY moved back and Forth between Fibonacci levels, with the pair holding above the 50% retracement of its latest bullish run at 138.40 but unable to regain the upside. Yen saw limited intraday strength despite stocks’ slide, which suggests the Japanese currency is still in selling mode. The1 hour chart shows indicators directionless above their midlines, with 100 SMA capping the upside around 139.00. In the 4 hours chart indicators stand steady below their midlines giving not much clues on upcoming direction. The 38.2% retracement of the same rally is the level to watch as a break above 139.15 should favor a steadier recovery up to 140.00 price zone.
Support levels: 138.40 137.90 137.35
Resistance levels: 139.15 139.60 140.00
GBP/USD Current price: 1.6247
View Live Chart for the GBP/USD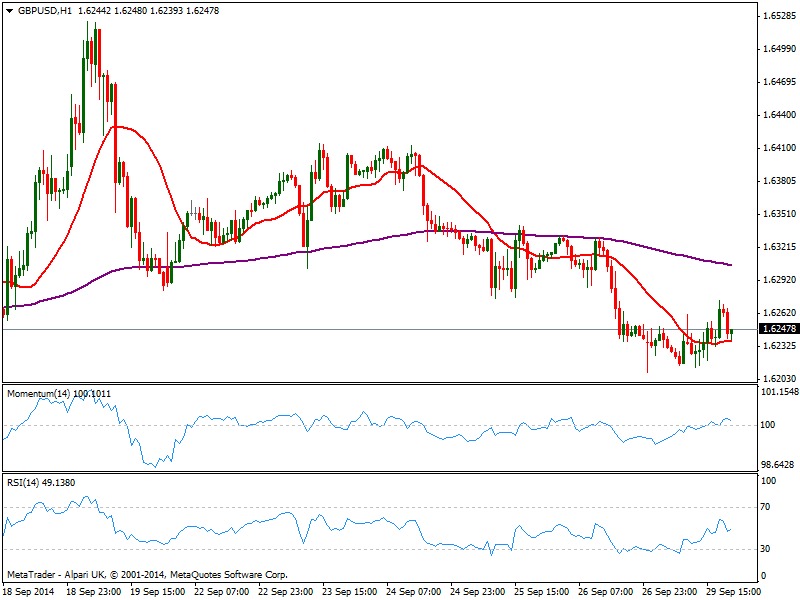
The GBP/USD recovered some form its early weekly opening dip to 1.6209, extending up to 1.6274 intraday. Trading midrange, the 1 hour chart shows price above a flat 20 SMA and indicators barely above their midlines, showing actually no real upward strength, while the 4 hours chart shows a strongly bearish 20 SMA capping the upside now around 1.6290 and indicators steady below their midlines. UK GDP will be release early Tuesday, along with some business investment index, which means the pair will likely remain in a limited range ahead of the news. Some uptick in the Q2 GDP reading is expected up to 3.2% which should keep Pound limited to the downside; a much better reading however, may put the pair in recovery mode, eyeing a quick advance up to 1.6345 strong static resistance zone.
Support levels: 1.6210 1.6185 1.6160
Resistance levels: 1.6290 1.6345 1.6380
USD/JPY Current price: 109.41
View Live Chart for the USD/JPY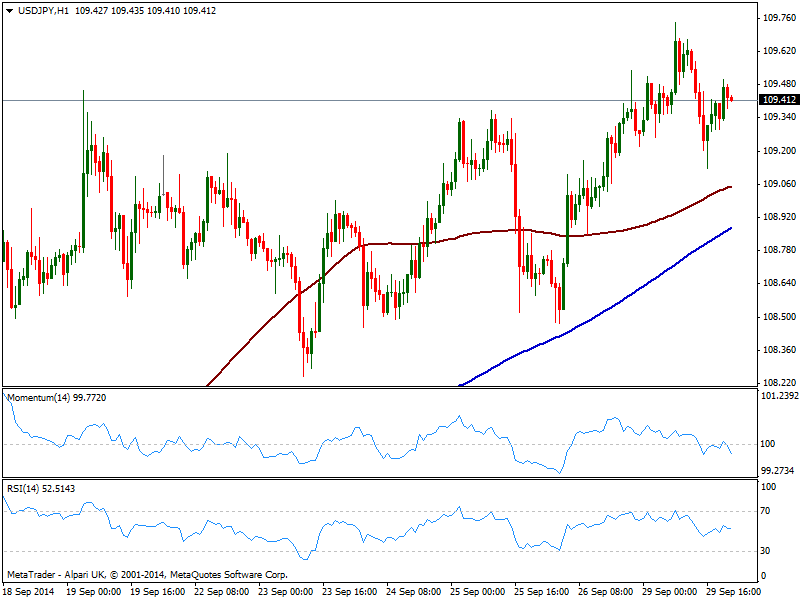
The USD/JPY posted a new multi-year high of 109.74 this Monday, with buyers surging on retracements down to 109.10/20 price zone. The 1 chart shows a mild bearish tone coming from indicators, heading south around their midlines, but price steady above its moving averages, albeit the distance between 100 and 200 SMA has shrank which means the run may be losing steam. In the 4 hours chart however, indicators regain the upside after correcting some, which keeps now the downside limited. A break below 108.90 is the level to watch as only below the risk will turn to the downside.
Support levels: 109.15 108.99 108.50
Resistance levels: 109.45 109.80 110.20
AUD/USD Current price: 0.8725
View Live Chart of the AUD/USD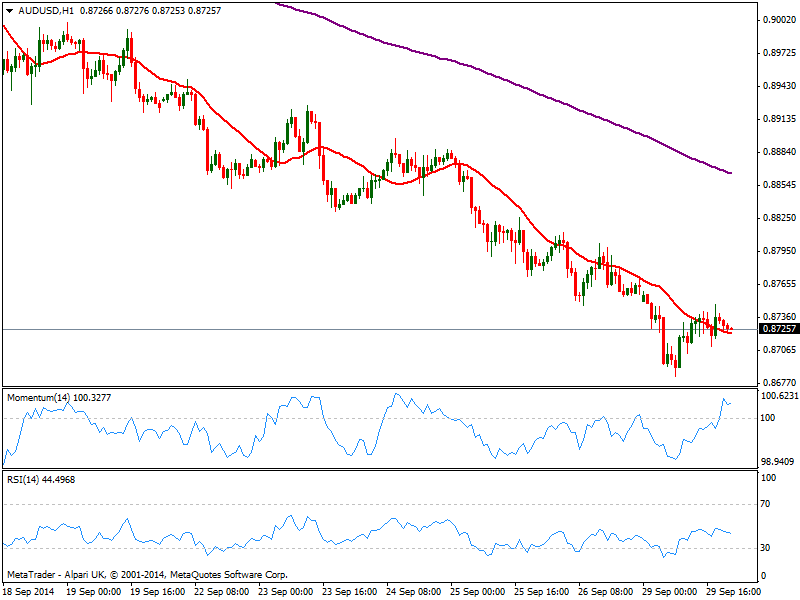
The AUD/USD maintains the negative tone seen on previous updates, with the pair closing the day in the red after posting a lower low of 0.8683. The decline has been quite steady ever since the pair failed to regain the 0.9400 price zone late August, with the daily chart now showing indicators in extreme oversold levels, yet so far giving no signs of an upward correction. Short term, the 1 hour chart shows indicators mixed in neutral territory, and price hovering around a flat 20 SMA, while the 4 hours chart shows the strong bearish tone prevails: price stands below a bearish 20 SMA as indicators head lower in negative territory after correcting oversold readings: a break below 0.8680 should trigger further slides in the pair eyeing 0.8630/40 area up next.
Support levels: 0.8710 0.8680 0.8635
Resistance levels: 0.8770 0.8800 0.8840
Recommended Content
Editors’ Picks
EUR/USD clings to marginal gains above 1.0750

EUR/USD trades in positive territory above 1.0750 in the second half of the day on Monday. The US Dollar struggles to find demand as investors reassess the Fed's rate outlook following Friday's disappointing labor market data.
GBP/USD edges higher toward 1.2600 on improving risk mood

Following Friday's volatile action, GBP/USD pushes higher toward 1.2600 on Monday. Soft April jobs report from the US and the modest improvement seen in risk mood make it difficult for the US Dollar to gather strength.
Gold climbs above $2,320 as US yields push lower

Gold trades decisively higher on the day above $2,320 in the American session. Retreating US Treasury bond yields after weaker-than-expected US employment data and escalating geopolitical tensions help XAU/USD stretch higher.
Addressing the crypto investor dilemma: To invest or not? Premium

Bitcoin price trades around $63,000 with no directional bias. The consolidation has pushed crypto investors into a state of uncertainty. Investors can expect a bullish directional bias above $70,000 and a bearish one below $50,000.
Three fundamentals for the week: Two central bank decisions and one sensitive US Premium

The Reserve Bank of Australia is set to strike a more hawkish tone, reversing its dovish shift. Policymakers at the Bank of England may open the door to a rate cut in June.