EUR/USD Current price: 1.3467
View Live Chart for the EUR/USD
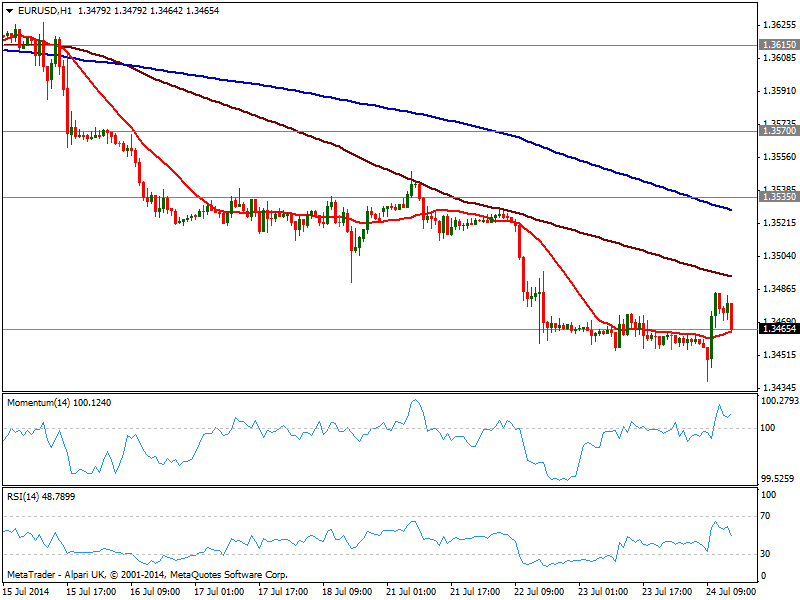
The EUR/USD has extended its intraday range by a few pips, posting a lower low for the year of 1.3437 before extending up to 1.3484 on the back of stronger than expected local PMI readings. Nevertheless, the pair was unable to sustain its shy gains and trades back in the 1.3460 price zone. The hourly chart shows price steady above its 20 SMA, and indicators mixed in positive territory, without showing a certain direction. In the 4 hours chart daily high converged, with a bearish 20 SMA that limited the upside, while indicators corrected oversold readings but hold in negative territory. As long as below the 1.3500 level, the pair remains exposed to the downside despite the tedious lack of strength.
Support levels: 1.3445 1.3410 1.3380
Resistance levels: 1.3500 1.3535 1.3570
GBP/USD Current price: 1.7000
View Live Chart for the GBP/USD
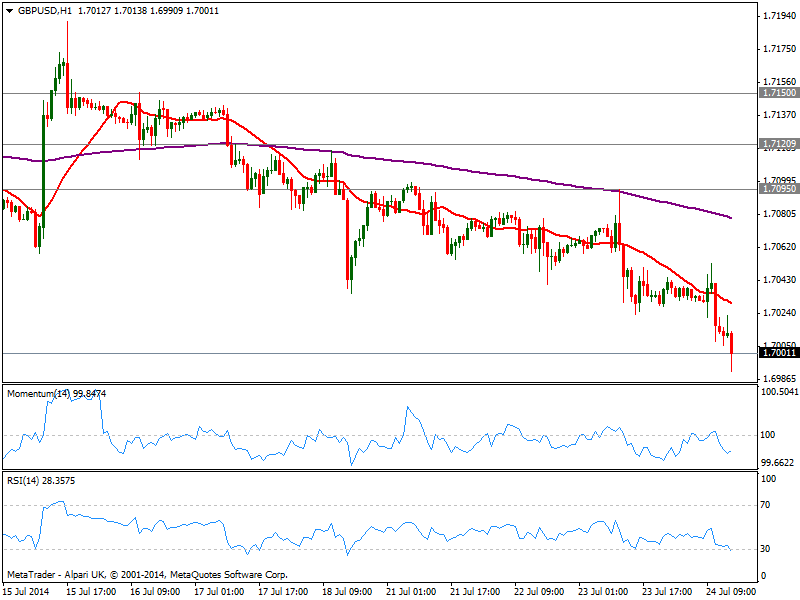
The GBP/USD aims to break below the 1.7000 mark after UK Retail Sales missed expectations, presenting a strong bearish tone in the short term, as the hourly chart shows price well below its 20 SMA and indicators heading lower below their midlines. In the 4 hours chart indicators also gained bearish momentum and extend below their midlines, supporting a continued slide towards 1.6950, June 26th daily low.
Support levels: 1.7020 1.6985 1.6950
Resistance levels: 1.7050 1.7095 1.7120
USD/JPY Current price: 101.70
View Live Chart for the USD/JPY
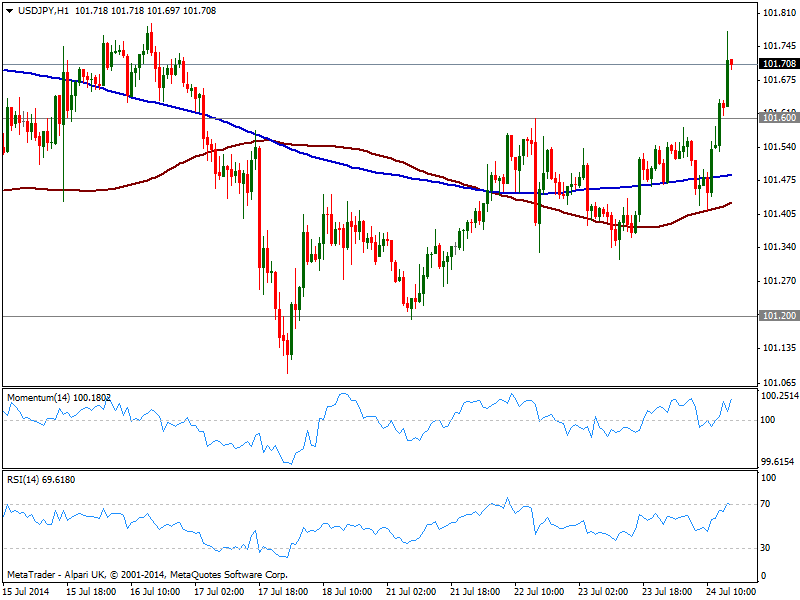
The USD/JPY finally advanced above 101.60, reaching so far 101.77 and maintaining a strong positive tone despite the shallow advance. The fact that stocks are strongly up, surely supports the rally, with the hourly chart showing a clear upward momentum in the hourly chart as price extends also above its moving averages. In the 4 hours chart indicators also head higher above their midlines, with critical resistance now at 101.95, 200 DMA. A break above this last should fuel the rally, eyeing then 102.35 price zone.
Support levels: 101.60 101.20 101.05
Resistance levels: 101.95 102.35 102.80
AUD/USD Current price: 0.9429
View Live Chart for the AUD/USD
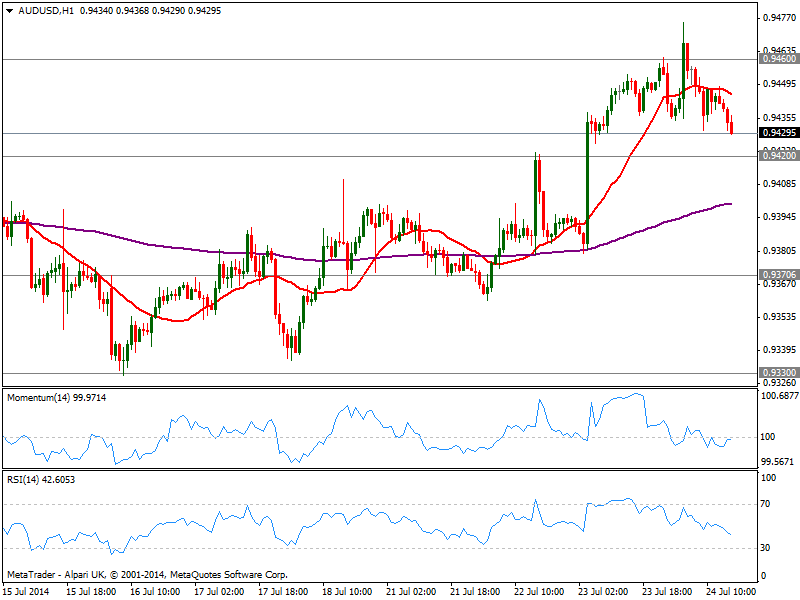
The AUD/USD retreats from 0.9475 fresh 3-week high posted over Asian hours, quickly approaching 0.9420 support. The hourly chart shows price back below its 20 SMA, while indicators head slightly south below their midlines. In the 4 hours chart indicators eased from oversold levels but hold above their midlines while 20 SMA maintains a strong bullish slope a few pips below current price. A price acceleration below 0.9410 should support a continued slide towards 0.9370 price zone.
Support levels: 0.9420 0.9370 0.9330
Resistance levels: 0.9460 0.9500 0.9540
Recommended Content
Editors’ Picks
EUR/USD drops to near 1.0650 ahead of Fed policy

EUR/USD continues its decline for the second consecutive day, hovering around 1.0650 during Asian trading hours on Wednesday. With European markets largely closed for Labour Day, investors are expecting the Federal Reserve's latest policy decision.
GBP/USD holds below 1.2500 ahead of Fed rate decision

The GBP/USD pair holds below 1.2490 during the early Wednesday. The downtick of the major pair is supported by the stronger US Dollar amid the cautious mood ahead of the US Federal Reserve's interest rate decision later on Wednesday.
Gold sellers keep sight on $2,223 and the Fed decision

Gold price is catching a breather early Wednesday, having hit a four-week low at $2,285 on Tuesday. Traders refrain from placing fresh directional bets on Gold price, anticipating the all-important US Federal Reserve interest rate decision due later in the day.
Ethereum dips below key level as Hong Kong ETFs underperform

Ethereum experienced a further decline on Tuesday following a disappointing first-day trading volume for Hong Kong's spot Bitcoin and ETH ETFs. This comes off the back of increased long liquidations and mixed whale activity surrounding the top altcoin.
Federal Reserve meeting preview: The stock market expects the worst

US stocks are a sea of red on Tuesday as a mixture of fundamental data and jitters ahead of the Fed meeting knock risk sentiment. The economic backdrop to this meeting is not ideal for stock market bulls.