Coronavirus Geometric Progression Suggests 100,000 Infections in a Week

Jim Bianco shared some of his coronavirus research with me yesterday. I asked if he would make the article public.
Thanks to Bianco please consider Coronavirus Growth Rates and Market Reactions.
This is a guest post courtesy of Bianco Research
Summary
The growth in coronavirus infections has continued along a geometric progression for the last 12 days. Should it continue along this path, infection cases could approach 100,000 in a week.
Comments
The following charts were constructed from the daily update from the National Health Commission of the People’s Republic of China.
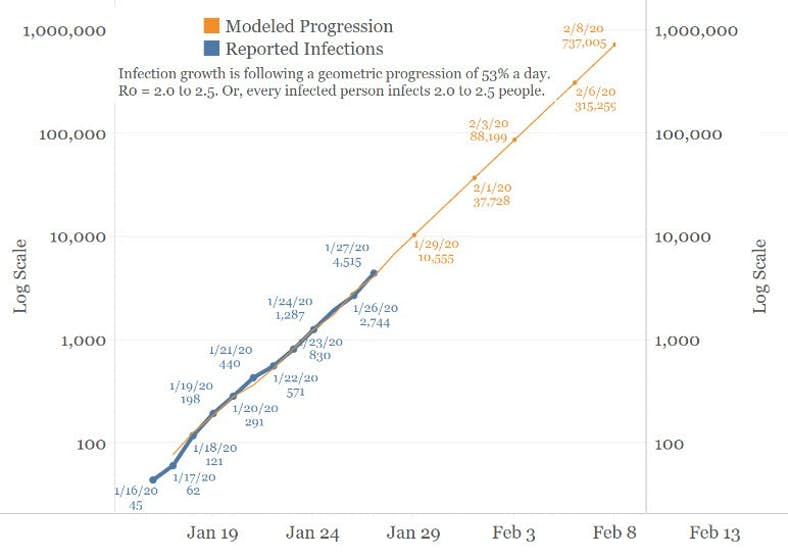
The blue line in the chart below shows the actual number of reported coronavirus cases stands at 4,515 as of January 27.
The orange line is a simple progression that assumes a 53% increase in the cases every day. Or, one person infects 2 to 2.5 people. So it is a simple multiplier, nothing more. This is known as R0 (R-Naught), or the infection rate. Note the chart is a log scale.
The reported number of infections perfectly track this simple multiplier. This is how viral inflections growth, along a geometric path.
If this track is not altered, the number of reported cases will top 16,000 by Friday.
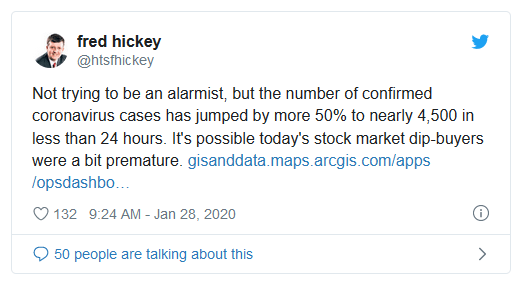
To many, such a geometric progression is alarming (see the tweet immediately above).
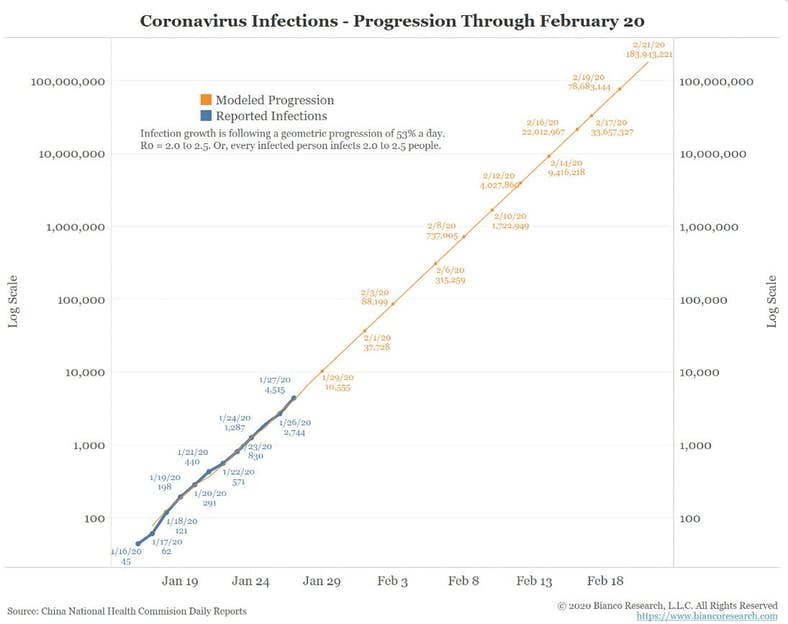
As the orange line shows, this type of growth rate would suggest 80,000+ infections next Monday and 138 million by February 20.
Is this growth rate possible? Over the near-term yes.
The National Health Commission of the People’s Republic of China offers another statistic, the number of people in quarantine suspected of having the coronavirus. As of January 27, over 44,000 are quarantined. Many of these people will unfortunately be reported as infected.
To be absolutely clear, this is NOT a prediction that 100 million people will be infected by Feb 20. Rather, this has been its growth rate for the last 12 days. A vaccine, mutation or successful quarantine/isolation could help reduce this growth rate.
Market Implications
Mongolia and North Korea have already closed their border with China. Hong Kong is restricting its border. As cases continue to emerge in Japan and outside of Asia, calls will grow for the Chinese to engage in drastic action to stop its spread.
This potentially means Chinese businesses will halt, flights will stop (see the plunge in crude oil on oversupply worries) and the global supply chain will grind to a halt. This could have enormous economic consequences for global growth.
While not overlooking the human tragedy, the markets have the difficult task of pricing an event that has a small chance of being devastating to global growth, but a more likely outcome of being contained. Yesterday’s selloff in stocks was likely a response to the fact that this virus has continued to grow at a geometric pace thus far. In trying to quantify the market impact, perhaps these charts offer one way to gauge the severity of this virus in the days ahead.
End Guest Post
Here is another link echoing Bianco's market concerns.
Thanks to Jim Bianco for these charts. He has a couple more including one on death rates that I did not copy.
Author

Mike “Mish” Shedlock's
Sitka Pacific Capital Management,Llc
Mike “Mish” Shedlock is a registered investment advisor for SitkaPacific Capital Management.