Charge-Offs Increase As The Debt Bubble Comes Close To Bursting

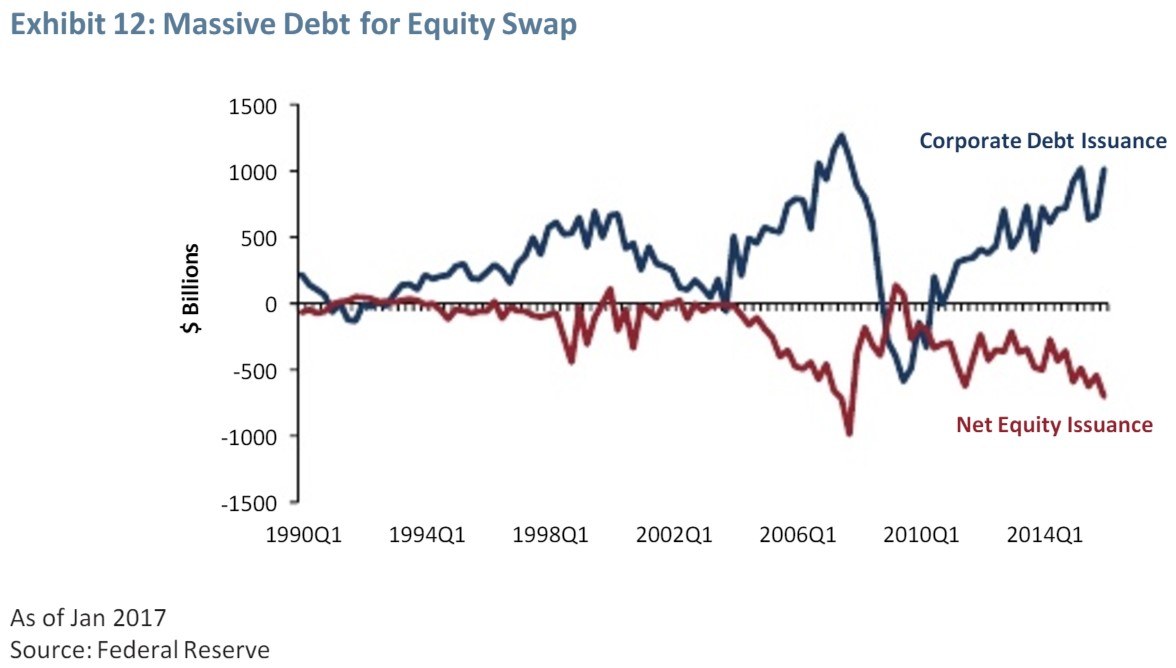
As a clarification to a previous article, I showed a chart which had an elevated level of equity financing as a percentage of U.S. M&A. It’s worth emphasizing that while equity issuances have been funding M&A at a high level, net equity issuance is the lowest since 2007. As you can see from the chart below, right before the financial crisis, debt was issued to fund a massive amount of buybacks. History is repeating itself as the current corporate debt issuance is almost as high as 2007 and the current net equity issuance is almost as low as 2007. This chart shows the debt bubble in its glory.
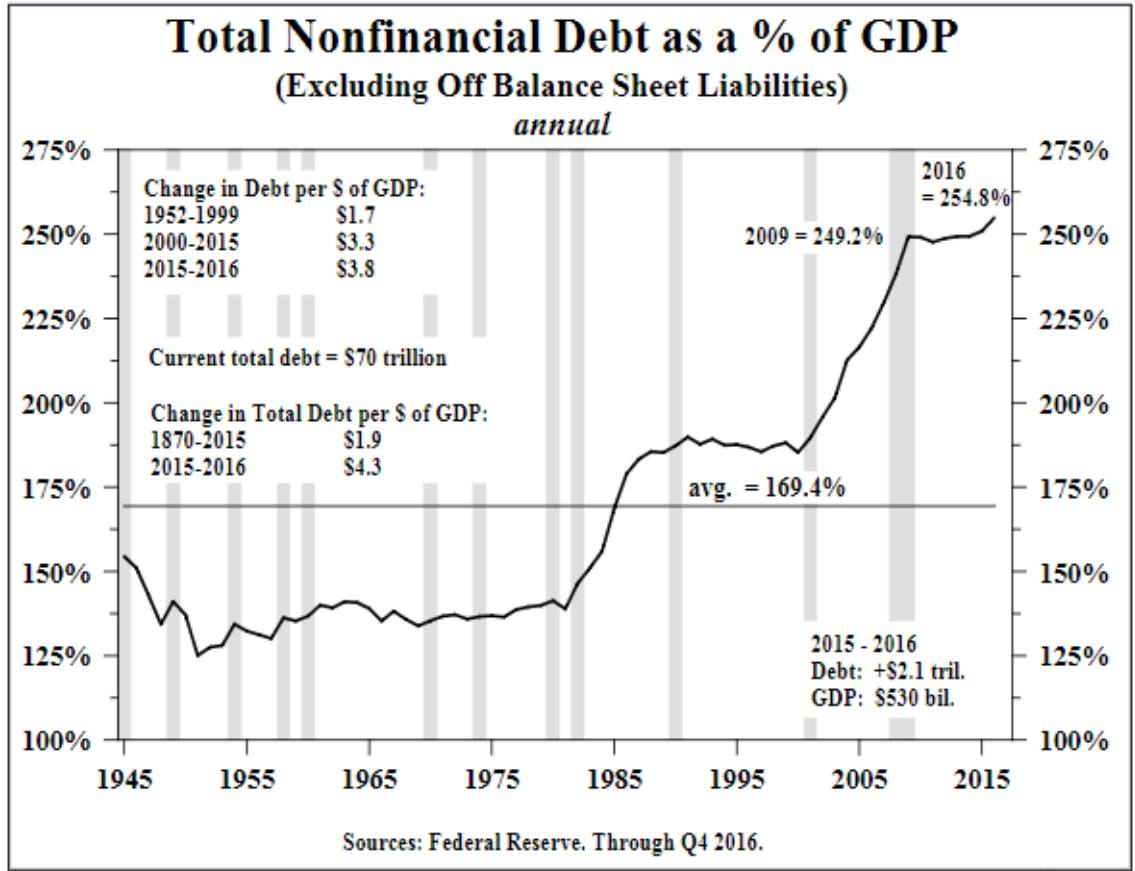
The chart below takes another look at the debt bubble. It shows the total nonfinancial debt as a percent of GDP. The debt never unwound after the 2008 financial crisis; now it is higher than ever. This lack of an unwind is why I think the next recession will be much worse than the last one. The economy needs to deleverage. A real deleveraging would send the debt as a percentage of GDP close to the average which is 169.4%. The debt per dollar of GDP in 2016 was over double the debt per dollar of GDP from 1952-1999.
Shorts An Endangered Species
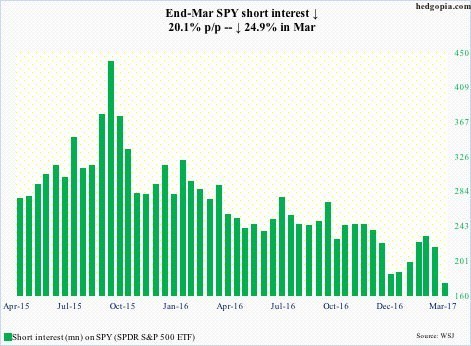
The stock market likes to deliver the most pain to the most investors. It delivered pain to short sellers in 2016 as they piled in to their shorts in the beginning of last year only to be met with a strong rally. This year short sellers in long bonds have been crushed. When there are some short sellers left in a bull market, it signals the bull market has room to run higher. When the shorts have covered and moved on to a new occupation, it signals the bull market is on its last legs. The chart below illustrates this point. There was a high short interest in late 2015 and early 2016 as short sellers thought the selloff would precede a recession in 2016. At the end of March short interest was down 20.1%. The decline in shorts should worry bullish investors especially since the market has been weak lately.
Charge-Offs Up
This week financials started reporting their earnings. The banks that reported earnings had good reports, but their stocks fell. JP Morgan reported earnings of $1.65 which beat expectations by thirteen cents. The stock fell 1% on the news. That’s a big sell off in my eyes because the stock had fallen almost 9% since March 1st. With the stock falling on good news after it was oversold, it’s strong negative sign.
The XLF financials ETF is down 9.27% since March 1st. One of the reasons financials may be falling is because President Trump said he favors a low interest rate policy. Banks had been rallying after the election because of the potential expansion of their net interest margins, but that expansion looks to be a mirage. Secondly, Bill Dudley said the Fed would pause the rate hikes when it begins to unwind the balance sheet. This lowering of potential rate hikes further slows the expansion of net interest margins.
More important than margins, is the weakening economy and the increasing consumer defaults. JP Morgan experienced an increase in charge-offs in its consumer loan division. In its review of the consumer and community banking division, the firm noted that expenses were $6.4 billion which was up 5% from last year. This increase was driven by higher auto lease depreciation. The first signs of the auto loan bubble are here. They won’t go away as the default cycle is just beginning.
Another point JP Morgan noted was that the credit costs of $1.4 billion were up $380 million which was driven by a write down in student loans and higher card net charge-offs. This uptick in problems with student loans makes sense as the level of student loan delinquencies has been elevated. The chart below shows the increase in card charge-offs. The net charge-off rate increased from 2.62% last year to 2.94%.
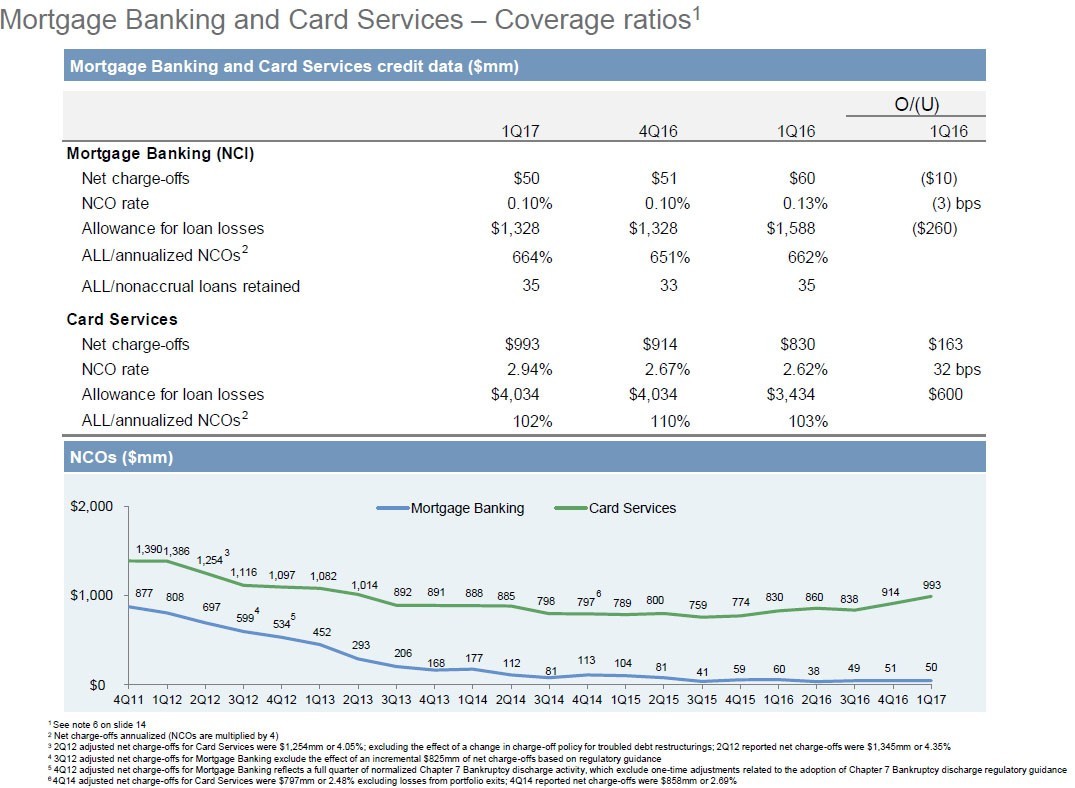
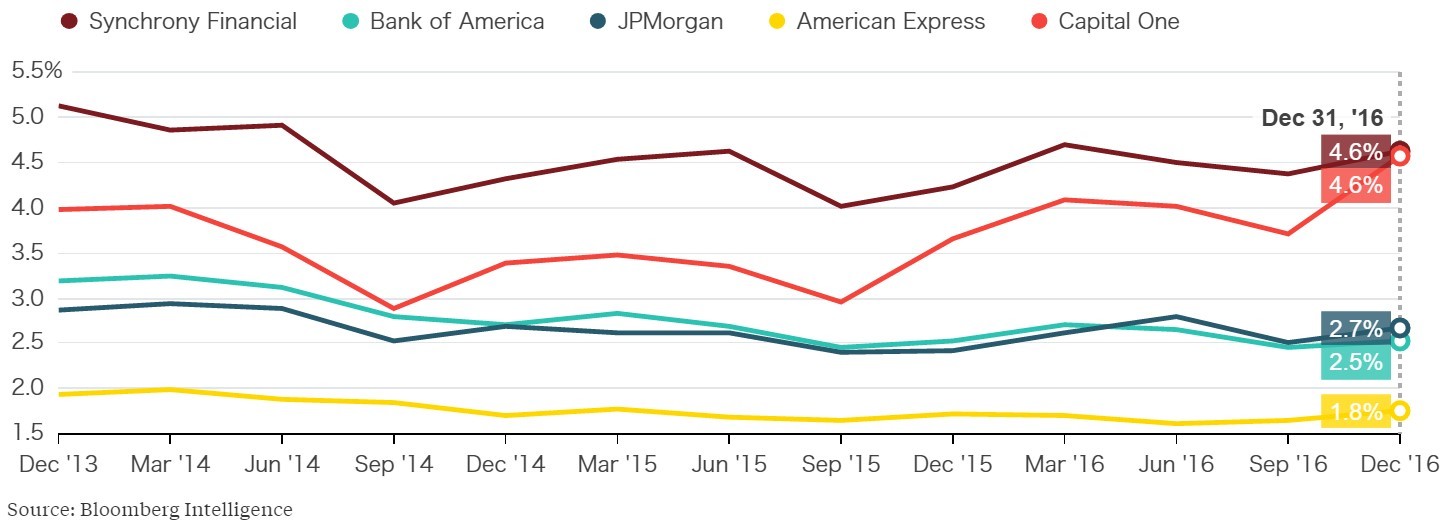
JP Morgan isn’t the only firm which is seeing an increase in delinquency rates. As you can see from the chart below, charge-off rates increased sequentially at the end of Q4 for other credit card firms. It’s interesting to see charge-offs increasing given how low interest rates remain. The $1 trillion bubble in consumer credit card loans is near its burst as it collapses under its own weight. JP Morgan had the lowest chart-off rate in Q4, so if it saw an increase in Q1, the others likely also had increases.
Besides interest rates being low, it’s also surprising to see charge-offs increasing because of the strong labor market. It’s true that wage increases have lagged CPI growth for most of this recovery, but that hadn’t catalyzed an increase in charge-offs in the past few years. As you can see in the chart below, the jobless claims fell this week after being elevated in the past couple weeks. This strong jobless claims reading goes against the weak BLS report last month which showed only 98,000 job gains. The BLS report may have been weakened by the winter storm in the northeast, but the jobless claims data this week may be manipulated by the timing of Easter. I’ll go with saying the labor market is strong until we get new data in the next few weeks.
Conclusion
This stock market bubble is funded by a massive debt for equity swap. The economy didn’t deleverage during the 2008 financial crisis because of government bailouts and quantitative easing. The corporate debt is now at where it was last cycle, but the situation is worse because government debt is higher and the Fed already has $4.5 trillion on its balance sheet. Short selling in the stock market declined in March which signals it’s near a top because the market likes to deliver the most pain to the most investors. Charge-offs are increasing on credit cards even though interest rates are low and the labor market is strong. The student loan bubble will collapse under its own weight because graduates can’t make the payments. Imagine how high the delinquency rate will get in the next recession.
Don Kaufman: Trade small and Live to trade another day at Theotrade.
Don Kaufman: Trade small and Live to trade another day at Theotrade.
Author

TheoTrade Analysis Team
TheoTrade, LLC
Don Kaufman, Co-Founder, Chief Derivatives Instructor (Trader Stocks, Options, Futures) Don is one of the industry's leading financial strategists and educational authorities.


