GBP/USD Elliott Wave technical analysis [Video]
![GBP/USD Elliott Wave technical analysis [Video]](https://editorial.fxstreet.com/images/Markets/Currencies/Majors/GBPUSD/iStock-1088749732.jpg)
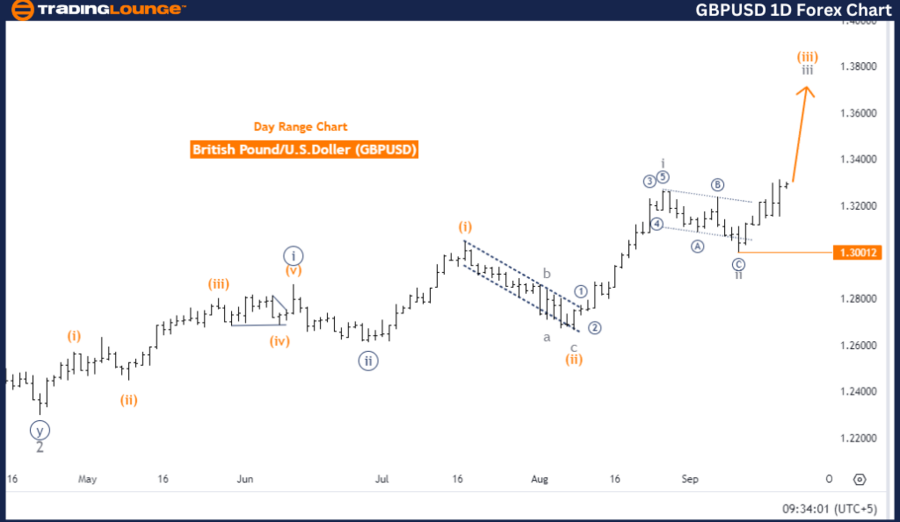
GBPUSD Elliott Wave Analysis – Trading Lounge Day Chart.
British Pound/ U.S. Dollar (GBPUSD) Day Chart.
GBP/USD Elliott Wave technical analysis
Function: Bullish Trend.
Mode: Impulsive.
Structure: Gray Wave 3.
Position: Orange Wave 3.
Direction next higher degrees: Gray Wave 3 (Continues).
Details: Gray Wave 2 of 3 appears completed, now Gray Wave 3 of 3 is underway.
Wave cancel invalidation level: 1.30012.
The Elliott Wave analysis for the GBPUSD daily chart reflects a bullish trend, indicating upward market movement. The current price action is in an impulsive mode, which signals sustained upward momentum in line with the broader market trend. The wave being monitored is Gray Wave 3, a significant wave in Elliott Wave theory, usually associated with strong upward movement within the trend.
Currently, the market is in Orange Wave 3, which is part of the larger impulsive structure of Gray Wave 3. This suggests that the price is in a phase where sustained upward momentum is expected, aligning with the overall bullish framework.
The direction of the next higher degree movements continues to point towards Gray Wave 3, further supporting the ongoing bullish momentum. It’s noteworthy that Gray Wave 2 of 3 has already completed, indicating that a corrective phase has passed. The market is now advancing into Gray Wave 3 of 3, a phase typically characterized by an extended upward push within the overall wave structure.
The wave cancel invalidation level is marked at 1.30012, meaning if the price drops below this point, the current Elliott Wave analysis would no longer hold. As long as the price stays above this threshold, the bullish trend is expected to persist, with potential for further gains as Wave 3 of 3 progresses.
Summary:
The GBPUSD pair is in a robust bullish trend, driven by the impulsive Gray Wave 3. With Gray Wave 2 now completed, the market is advancing into Gray Wave 3 of 3, which indicates strong upward momentum. The analysis remains valid as long as the price remains above 1.30012.
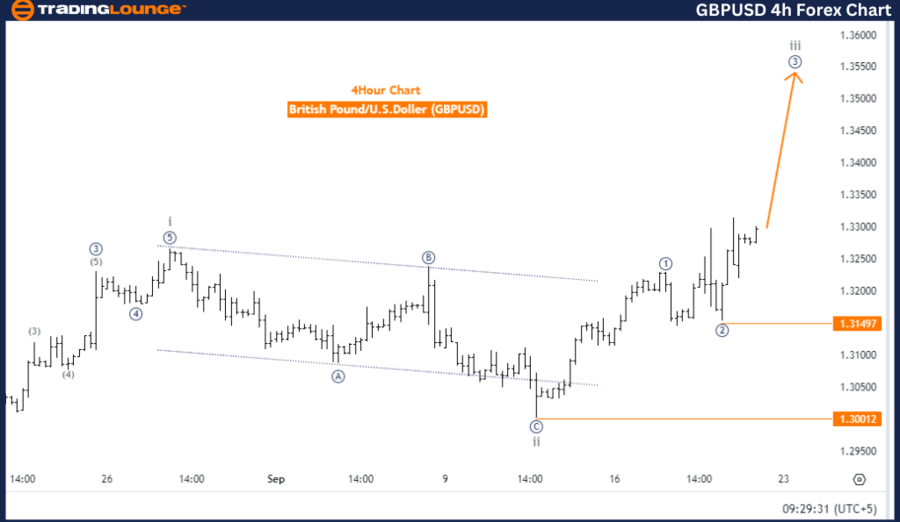
British Pound/ U.S. Dollar (GBPUSD) 4 Hour Chart.
GBP/USD Elliott Wave technical analysis
Function: Bullish Trend.
Mode: Impulsive.
Structure: Micro Navy Blue Wave 3.
Position: Gray Wave 3.
Direction next lower degrees: Micro Navy Blue Wave 4.
Details: Micro Navy Blue Wave 2 of 3 appears completed, now Micro Navy Blue Wave 3 of 3 is underway.
Wave cancel invalidation level: 1.30012.
The Elliott Wave analysis for the GBPUSD 4-hour chart shows a bullish trend, indicating upward market momentum. The current price movement is in an impulsive mode, suggesting that the price is advancing in strong waves that align with the overall market trend. The wave being tracked is Micro Navy Blue Wave 3, which represents a continuation of the larger impulsive sequence.
In terms of its current position, the market is within Gray Wave 3, a significant upward wave in the larger trend structure. The next lower degree wave points towards Micro Navy Blue Wave 4, implying that after the completion of the ongoing Wave 3, a corrective Wave 4 may follow. For now, the focus remains on the ongoing impulsive Wave 3.
The analysis highlights that Micro Navy Blue Wave 2 of 3 has been completed, indicating the end of a corrective phase. The market is now moving into Micro Navy Blue Wave 3 of 3, signaling strong upward momentum. This wave is typically known as one of the most extended and powerful in Elliott Wave theory, suggesting significant bullish potential for the market.
The wave cancel invalidation level is set at 1.30012. As long as the price stays above this level, the current Elliott Wave count remains valid, and the bullish structure is expected to continue.
Summary:
The GBPUSD is currently in a bullish impulsive phase, driven by Micro Navy Blue Wave 3. With Micro Navy Blue Wave 2 completed, the market is progressing through Wave 3 of 3, showing strong upward momentum. The analysis remains valid as long as the price stays above 1.30012.
Technical analyst: Malik Awais.
GBP/USD Elliott Wave technical analysis [Video]
Author

Peter Mathers
TradingLounge
Peter Mathers started actively trading in 1982. He began his career at Hoei and Shoin, a Japanese futures trading company.


