Cass Freight Index Down 9th Month "Signaling Economic Contraction”

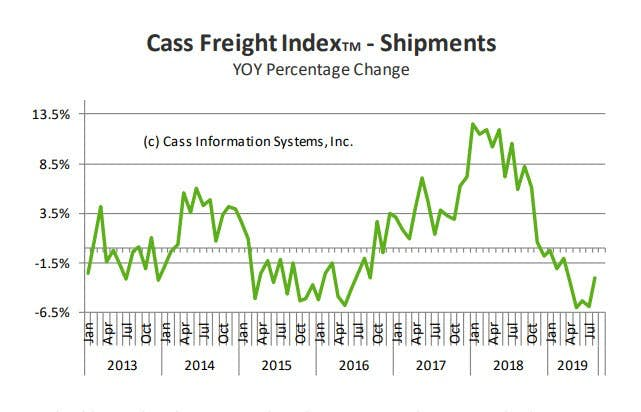
Year-over-year freight volume is down nine consecutive months starting December of 2018.
The Cass Freight Index report cites "More Signs of Contraction".
- When the December 2018 Cass Shipments Index was negative for the first time in 24 months, we dismissed the decline as reflective of a tough comparison. In January and February 2019, we again made rationalizations. When March was also negative (-1.0%), we warned that we were preparing to “change tack” in our outlook; when April was down (-3.2%), we said, “we see material and growing downside risk to the economic outlook.”
- With the -3.0% drop in August, following the -5.9% drop in July, -5.3% drop in June, and the -6.0% drop in May, we repeat our message from last three months: the shipments index has gone from “warning of a potential slowdown” to “signaling an economic contraction.”
- We acknowledge that: all of these negative percentages are against extremely tough comparisons, and the Cass Shipments Index has gone negative before without being followed by a negative GDP. However, weakness in demand is being seen across most modes of transportation, both domestically and internationally, with many experiencing increases in the rates of decline.
- We know that freight flows are a leading indicator, so by definition there is a lag between what they are predicting and when the outcome is reported. Nevertheless, we see a growing risk that GDP will go negative by year’s end.
- The weakness in spot market pricing for many transportation services, especially trucking, is consistent with the negative Cass Shipments Index and, along with airfreight and railroad volume data, strengthens our concerns about the economy and the risk of ongoing trade policy disputes. Weakness in commodity prices, and the ongoing decline in interest rates, have all joined the chorus of signals calling for an economic contraction.
Cass asks "When Will the GDP Turn Negative?"
Year-Over-Year Drops
Those reported monthly drops are not what they may seem at first glance. They are year-over-year drops not sequential drops.
The report says "another 3% in August". It's really another month of year-over-year contraction.
Europe and Asia
- Airfreight volumes in Europe continue to suggest that the region’s economy continues to cool.
- Airfreight volumes in Asia suggest that the region is on the verge of, or is already entering, a recession.
- As we’ve highlighted before, when trade tariffs slow the rate of growth for our global trading partners, it poses a real threat to the U.S. rate of economic growth.
European Airfreight

Our European Airfreight Index was down a concerning -7.2% in April, only down -2.6% in May, dropped -7.5% in June, and the July index fell -5.8%, and consistent with the deteriorating Eurozone PMI. While the -6.9% July overall drop in London airfreight volume suggests that economic headwinds from Brexit remain, particularly since the largest rates of decline (down -11% to -25%) are being experienced in the lanes between (to and from) London and other EU airports. Although the European data is by itself distressing, it’s the Asian data that has become the most alarming.
Asia Pacific Airfreight
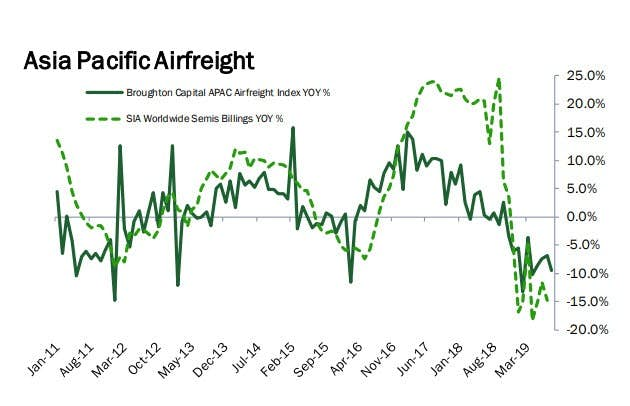
Asian airfreight volumes were essentially flat from June to October 2018, but have since deteriorated at an accelerating pace (November -3.5%, December -6.1%, January –5.4%, February -13.2%, March -3.6%, -10.2% in April, -8.5% in May, -7.4% in June, -6.8% July, and preliminary August -9.4%).
If the overall volume wasn’t distressing enough, the volumes of the three largest airports (Hong Kong, Shanghai, and Incheon) are experiencing the highest rates of contraction.
Cass Shipments vs GDP
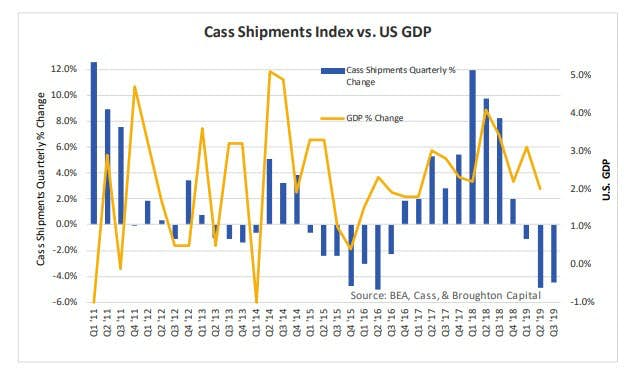
Based on the trend since the beginning of the year, but especially the data over the last four months, the Cass Shipments Index is signaling that GDP may be negative, or at least come close to being negative, in Q3. If it does not, since reported GDP often lags the economic activity represented by freight flows, continued weakness in the Cass Shipments Index at the current magnitude should result in a negative Q4 GDP.
Dat Dry Van Trucking
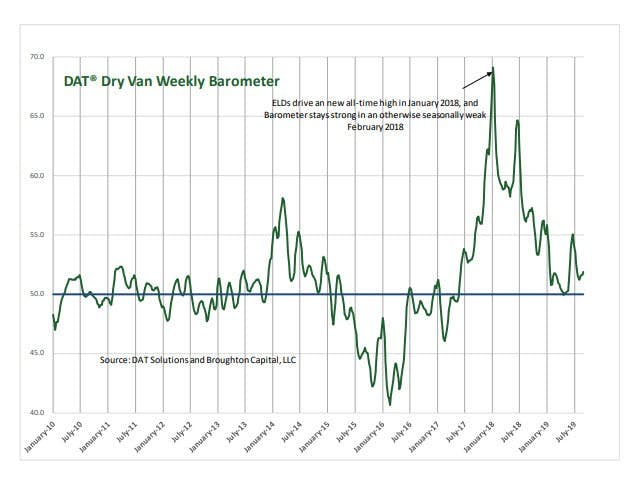
The Consumer Economy - We should note that dry van trucking volume has historically been a fairly reliable predictor of retail sales (container volume serves a similar role).
When studied using the DAT Dry Van Barometer, current demand is at levels in line with capacity, which suggests that the consumer economy is still relatively healthy and that retail sales are not contracting.
That said, this is a period that seasonally should be seeing much stronger volumes, which makes us cautious about the outlook for demand in September and October.
DAT Flatbed Trucking
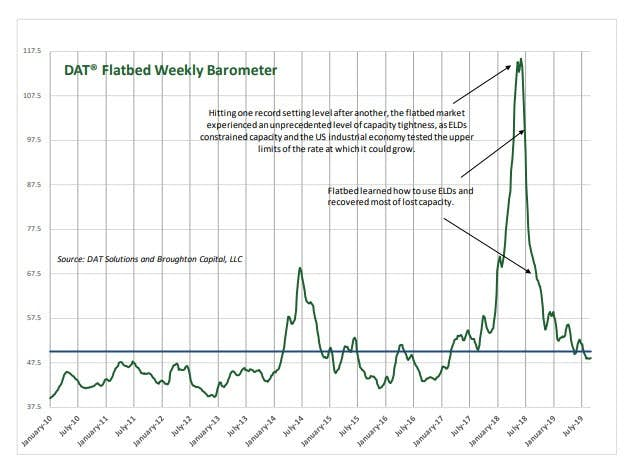
The DAT Flatbed Barometer indicating that capacity exceeds demand is a negative sign for the U.S. industrial economy. In line with recent rail volumes, it has started to suggest a more bearish outlook.
There are many more charts in the article.
Author

Mike “Mish” Shedlock's
Sitka Pacific Capital Management,Llc
Mike “Mish” Shedlock is a registered investment advisor for SitkaPacific Capital Management.


