Bitcoin Analysis: Bearish reversal confirmed, eyes $3500

Bitcoin [BTC] may have topped out, at least for the short-term at a time when its rival Bitcoin Cash [BCC] is scaling new heights. Thursday’s Doji candle [bullish exhaustion] on the BTC daily chart, followed by a negative price action on Friday confirmed a bearish trend reversal.
As per coinmarketcap.com, BTC has shed 2% over the last 24 hours to trade around $4042 levels. Its rival BCC clocked record highs above $900 over the weekend, before shedding 10.8% in the last 24 hours to trade around $704 levels.
Volumes rise
Volumes in bitFlyer jumped 17.9% in the last 24 hours. This adds credence to the bearish price reversal and suggests the sell-off is likely to be extended this week. Meanwhile, BCC’s volume on Bithumb has jumped 41.59%. As per cointelegraph.com, the trading volume in Bitcoin Cash has overtaken Bitcoin.
Gatecoin CEO sees BTC rallying to $5000 this year
While talking to Bloomberg on Daybreak Asia show, Aurélien Menant, CEO of Gatecoin [Bitcoin and Ethereum token exchange] said, “Uncertainties in other markets are driving more and more interest in Bitcoin. Another factor that is very important is the arrival of more and more institutional investors.” He described the virtual currency as a safe haven and said that prices could rally to $5000 this year.
Technicals
Daily Chart
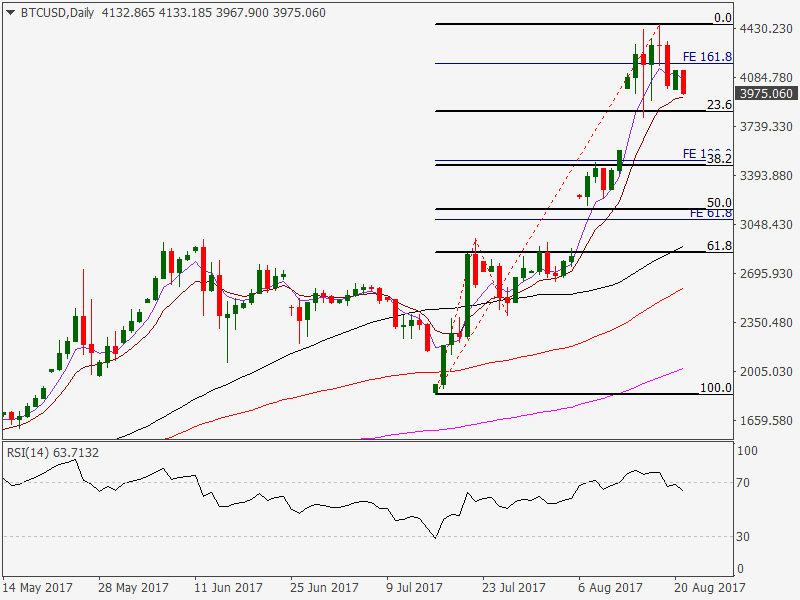
- Bearish Doji reversal confirmed
- 5-DMA has topped out
- 14-day RSI has turned lower from the overbought territory
4-hour Chart
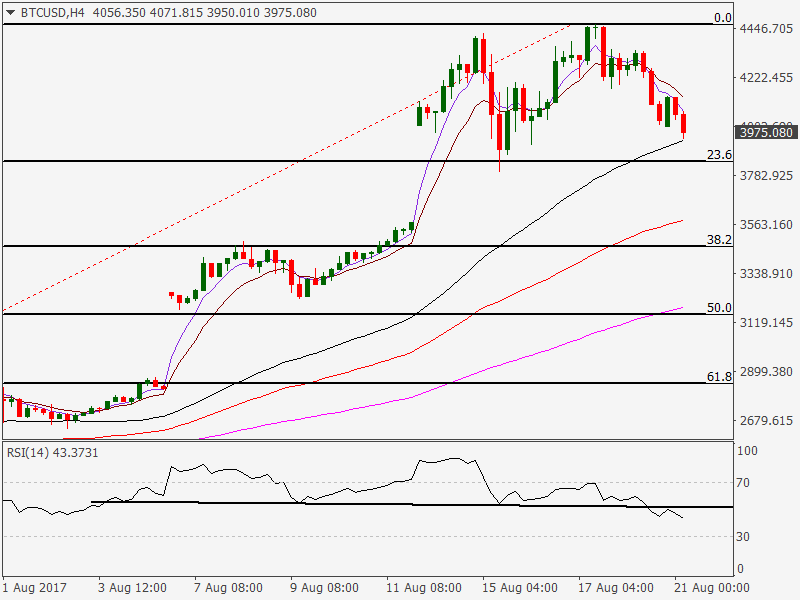
- Bearish RSI divergence
- Head and Shoulders breakdown on the RSI
Support
- $3938 [4-hour 50-MA]
- $3802 [Supp on 4-hour chart]
- $3454 [38.2% Fib R of July 6 low - Aug 17 high]
Resistance
- $4143 [1-hour 100-MA]
- $4322 [Aug 14 high]
- $4464 [last week’s high]
View
- BTC has topped out as indicated the bearish Doji reversal on the daily chart and the bearish price RSI divergence and head and shoulders breakdown on the 4-hr price/RSI chart.
- The currency looks set to test support at $3802 and possibly extend losses to $3500 levels.
- On the higher side, only a break above $4133 would open doors for re-test of $4300-4350 levels.
Author

Omkar Godbole
FXStreet Contributor
Omkar Godbole, editor and analyst, joined FXStreet after four years as a research analyst at several Indian brokerage companies.


