Bearish Expectations, Will Stocks Continue Lower?

Stocks traded within a short-term consolidation yesterday following their Tuesday’s rebound. The S&P 500 index remains close to the 2,850 mark. Will it break below the recent local lows? Or is this just another bottoming pattern before upward reversal?
The U.S. stock market indexes lost 0.3-0.5% on Wednesday, extending their short-term consolidation, as investors hesitated following Tuesday’s rebound. Last week the S&P 500 index fell the lowest since late March, and it got very close to the 2,800 mark (the local low at 2,801.43). Then it rebounded to the resistance level of around 2,890-2,900. It currently trades 3.3% below its May the 1st record high of 2,954.13. The Dow Jones Industrial Average lost 0.4% and the Nasdaq Composite lost 0.5% on Wednesday.
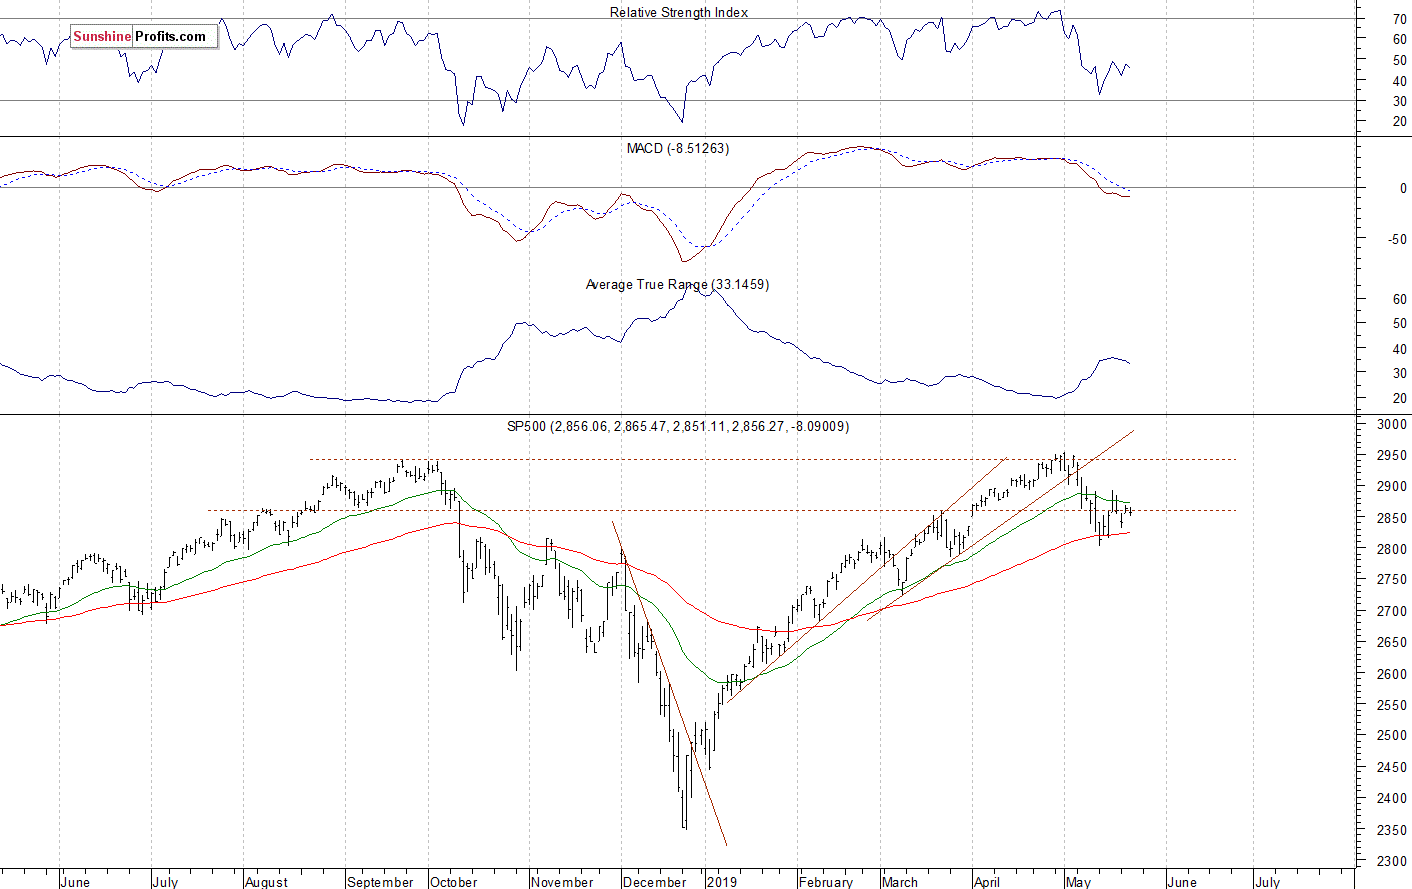
The nearest important resistance level of the S&P 500 index remains at 2,885-2,890, marked by the recent local highs. On the other hand, the support level is at 2,850-2,855. The support level is also at around 2,830, marked by Monday’s local low.
The broad stock market retraced all of its December sell-off and it broke above the last year’s high recently. But then the index broke below the short-term consolidation and it retraced all of the April’s advance. The market also broke below its two-month-long upward trend line. Last week the S&P 500 index retraced some of its recent declines. For now, it looks like an upward correction before another leg down:
Very Negative Expectations, Resuming Downtrend?
Expectations before the opening of today's trading session are negative, because the index futures contracts trade 0.9-1.2% below their Wednesday’s closing prices. The European stock market indexes have lost 1.3-1.7% so far. Investors will wait for series of economic data announcements today: Unemployment Claims at 8:30 a.m., Flash Manufacturing PMI, Flash Services PMI at 9:45 a.m., New Home Sales at 10:00 a.m. The broad stock market will likely get back to its recent local low today. If the S&P 500 index breaks below the support level of around 2,830, we could see more selling pressure.
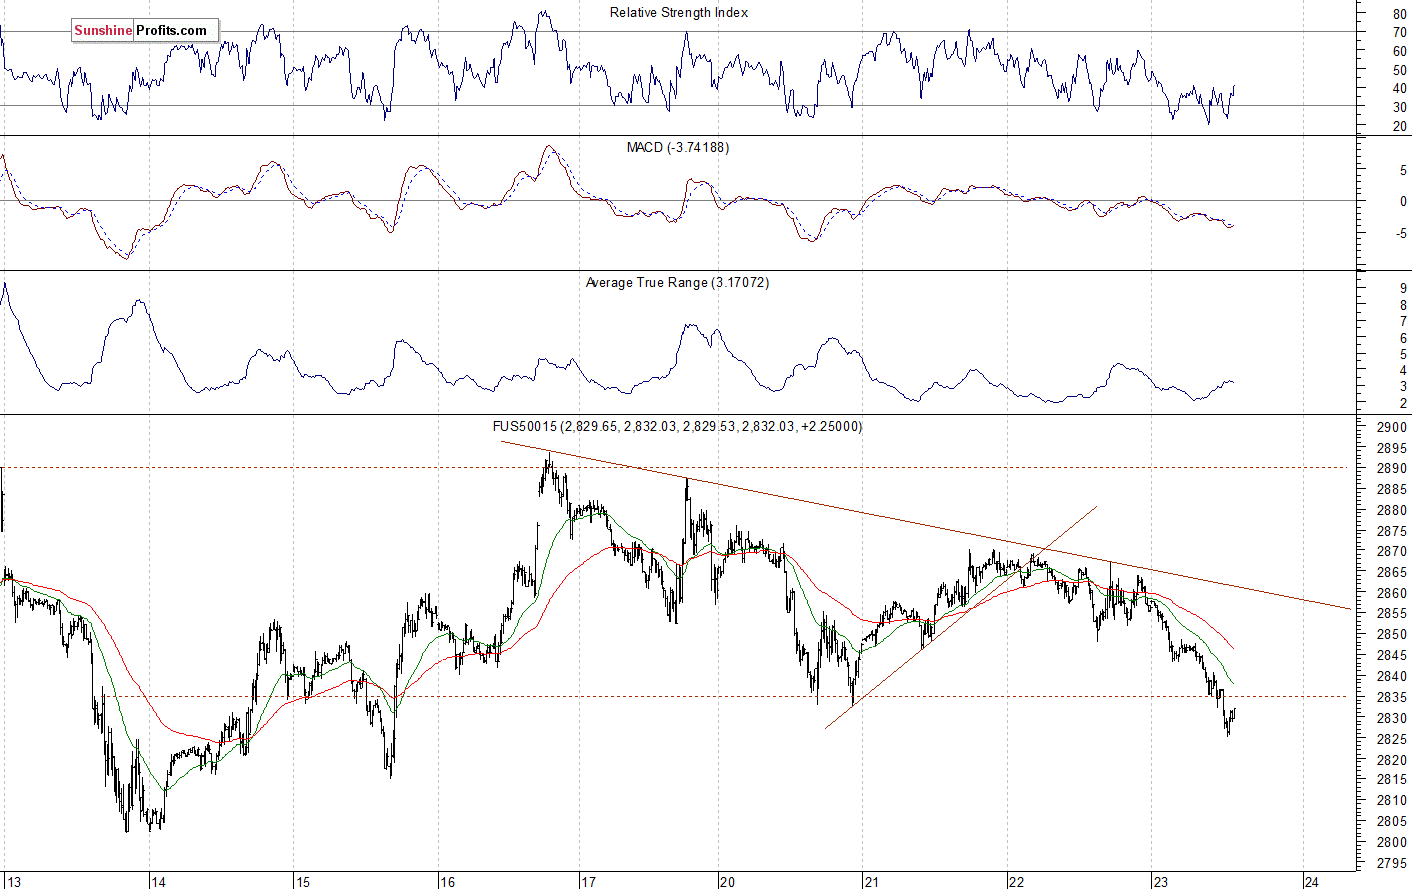
The S&P 500 futures contract trades within an intraday downtrend, following breaking below the 2,850 mark. The nearest important resistance level is now at 2,850. On the other hand, the support level is at 2,815-2,825. The futures contract remains below its week-long downward trend line, as we can see on the 15-minute chart:
Nasdaq Also Lower
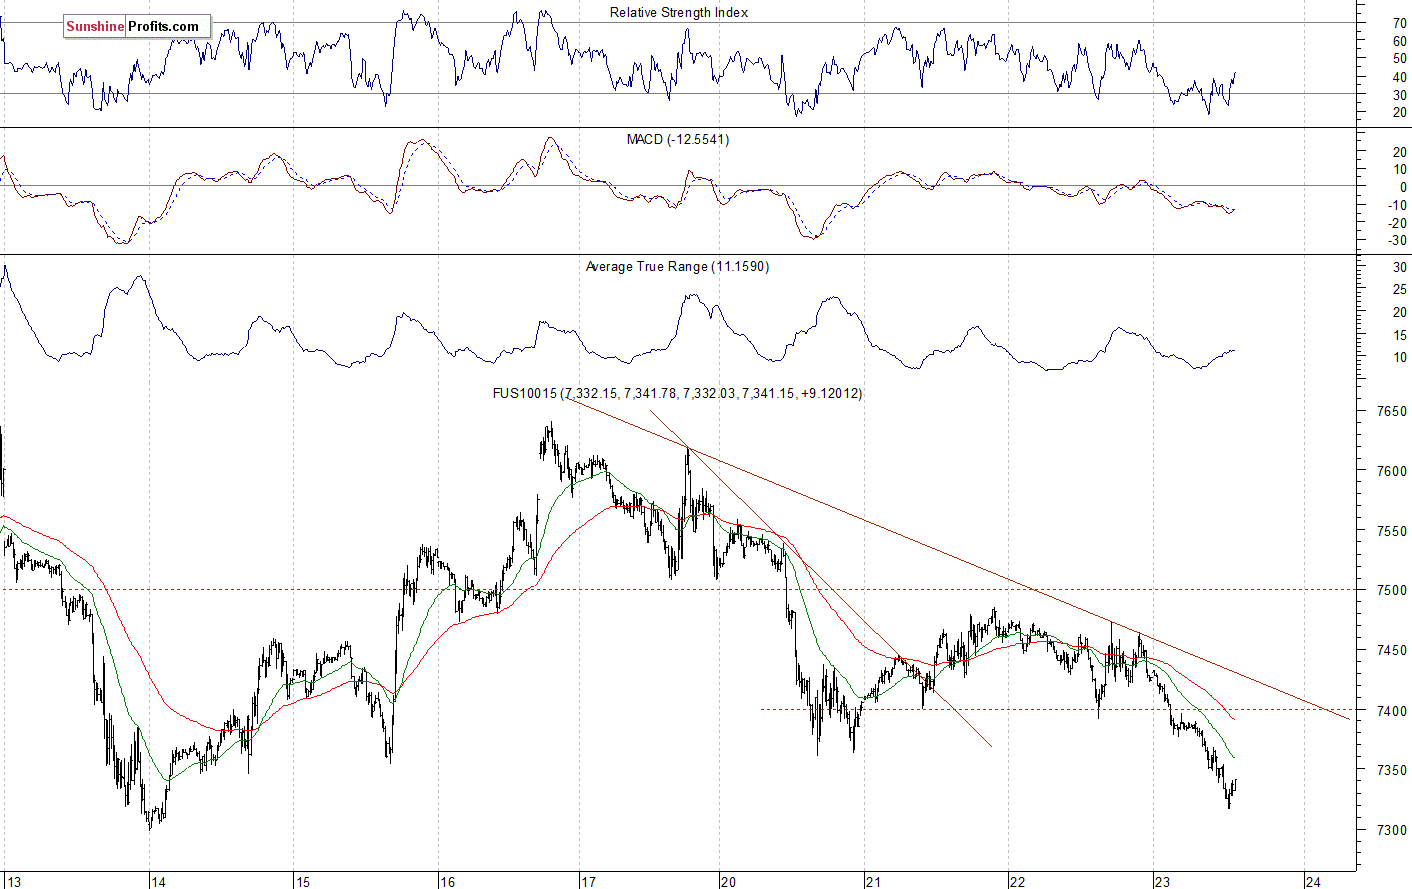
The technology Nasdaq 100 futures contract follows a similar path, as it trades much lower this morning. The market fell almost 600 points from its late April record high of around 7,880, before bouncing off the 7,300 mark more than a week ago. It retraced more than 300 points from that local low. But then it reversed its upward course again. The resistance level is now at around 7,400, marked by the recent local low. On the other hand, the support level is at 7,300. The Nasdaq futures contract trades below its Monday’s local low this morning, as the 15-minute chart shows:
Big Cap Tech Stocks Still Going Sideways
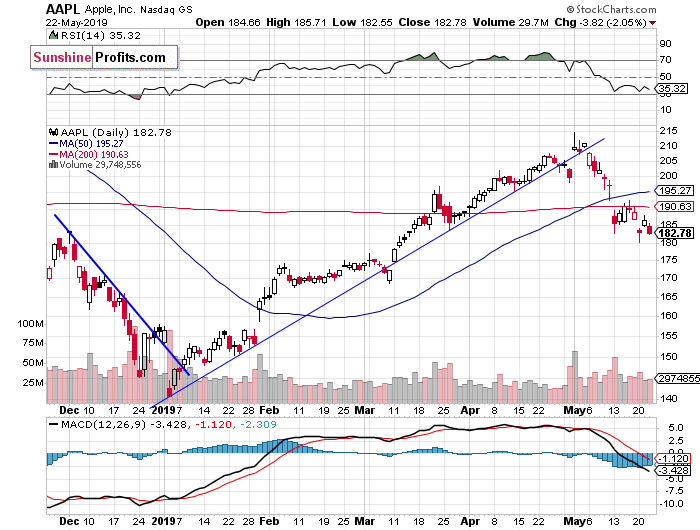
Let's take a look at the Apple, Inc. stock (AAPL) daily chart (chart courtesy of http://stockcharts.com). The stock extended its rally on May the 1st following the quarterly earnings release. Then the price reversed its upward course and broke below the medium-term upward trend line. Since the previous week it is fluctuating below the short-term resistance level of $190:
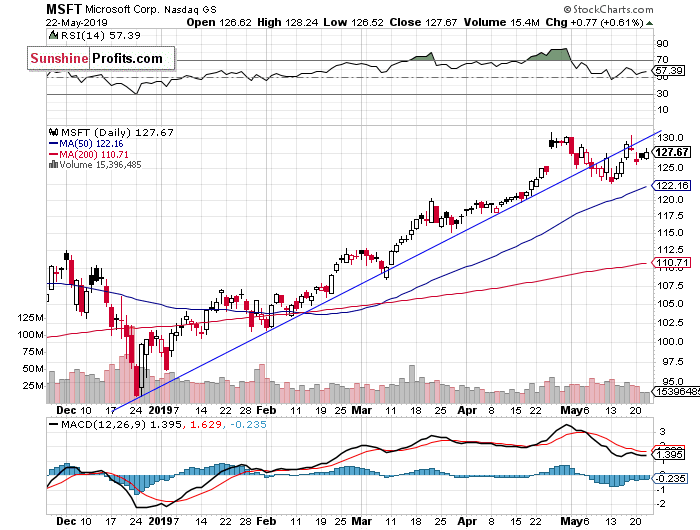
Now let's take a look at the daily chart of Microsoft Corp. (MSFT). The stock accelerated its uptrend in the late April, as it reached the new record high of $131.37. Investors reacted to a better-than-expected quarterly earnings release. Since then, the market was trading within a downward correction. On Friday it got back closer to the resistance level of $130-132, but then on Monday it retraced some of the advance:
Dow Jones – Short-Term Consolidation
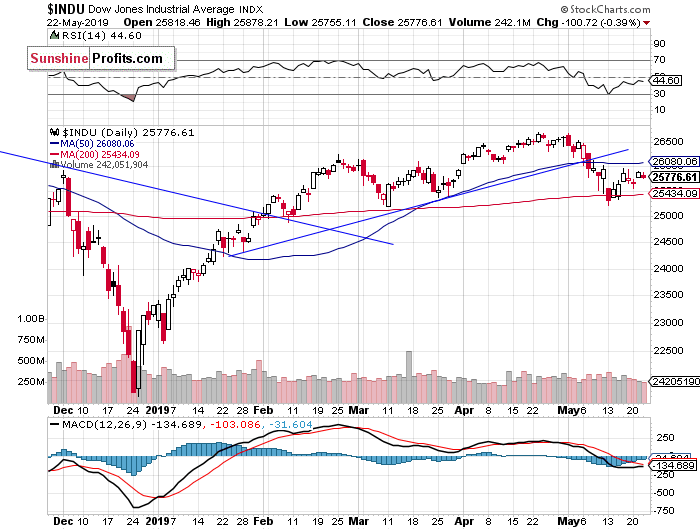
The Dow Jones Industrial Average has been relatively weaker than the broad stock market since February. The resistance level remained at around 26,800-27,000, marked by the last year’s topping pattern and the record high of 26,951.8. Last week the blue-chip stocks’ gauge followed the broad stock market, as it accelerated the downtrend. But then the market bounced off its important 200-day moving average:
Nikkei – More Uncertainty Following Breakdown Below the Trend Line
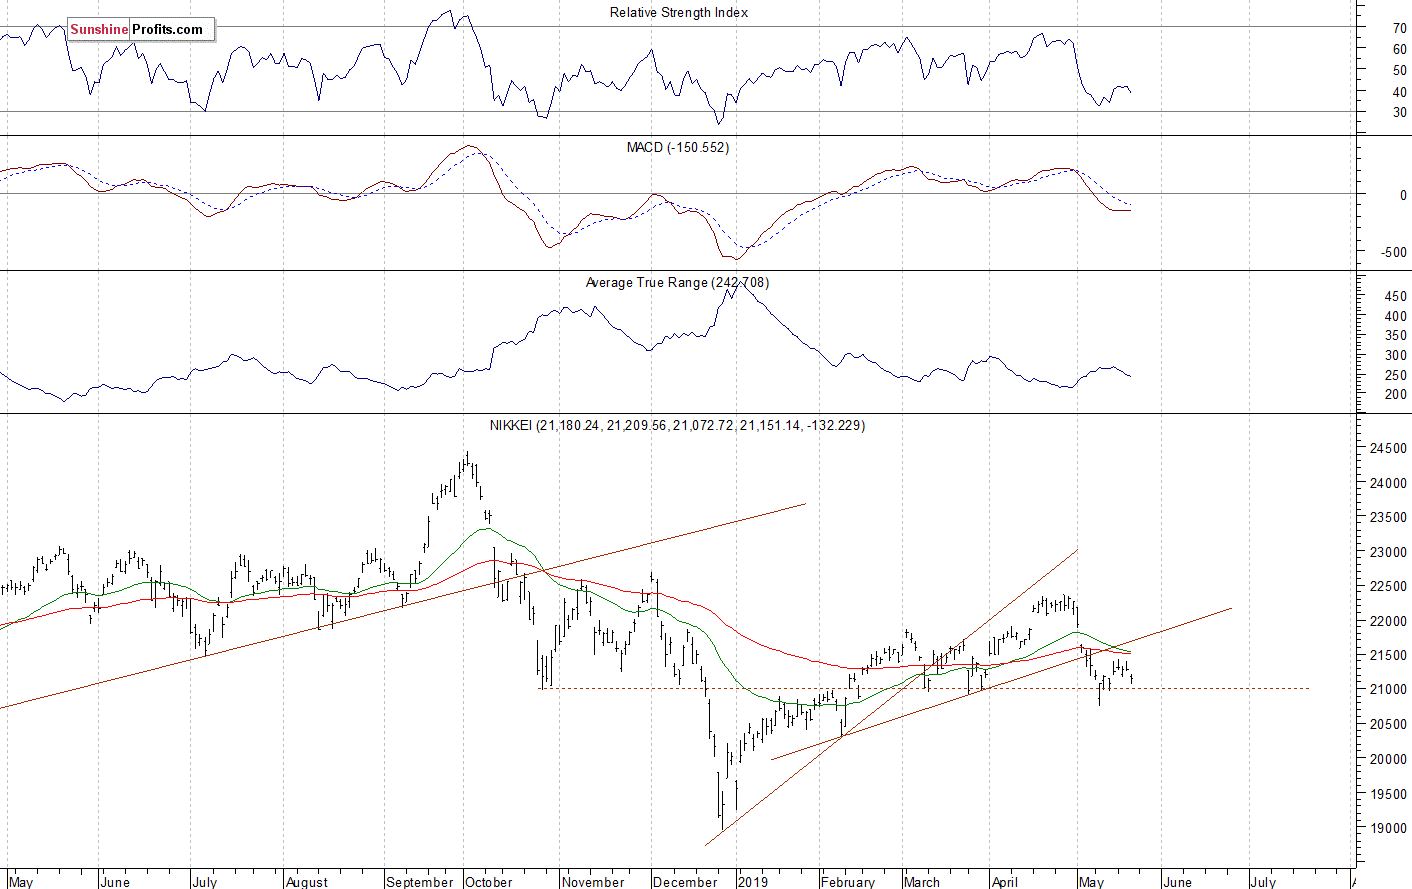
Let's take a look at the Japanese Nikkei 225 index. It accelerated the downtrend in late December, as it fell slightly below the 19,000 level. Then it was retracing the downtrend for several months. Recently the market broke below its three-month-long upward trend line:
The S&P 500 index has reached the new record high on May the 1st. The broad stock market extended its medium-term uptrend, as investors’ sentiment remained very bullish following economic data, quarterly corporate earnings releases. But then it quickly retraced its April’s advance following the renewed trade war fears. A week ago it sold off to the 2,800 mark. Since then it is trading within a short-term consolidation.
Concluding, the S&P 500 index will likely open lower today. Then we may see more short-term sideways trading action following the early May decline. Investors will await series of economic data releases.
Want free follow-ups to the above article and details not available to 99%+ investors? Sign up to our free newsletter today!
Author

Paul Rejczak
Sunshine Profits
Paul Rejczak is a stock market strategist who has been known for the quality of his technical and fundamental analysis since the late nineties.


