AUD/USD Price Forecast: The resumption of the uptrend appears on the cards
- AUD/USD managed to resume its uptrend and briefly surpass 0.6900.
- The US Dollar extended its weekly recovery on geopolitical jitters.
- The Ai Group Industry Index improved to -18.6 in September.

AUD/USD faced renewed buying interest and broke above the key 0.6900 the figure once again on Wednesday, all despite another positive day in the US Dollar (USD), this time propped up by increasing tensions in the Middle East.
Indeed, demand for the safe haven universe remained steady on Wednesday, hurting the sentiment around the risk-related assets.
However, the Aussie Dollar weathered the continuation of the march north in the Greenback on the back of decent gains in copper prices and further consolidation in the upper range in iron ore prices, all in response to the recently announced stimulus packages aimed at breathing some signs of life into China’s economy.
On the monetary policy front, the Reserve Bank of Australia (RBA) left rates unchanged at 4.35% during its September 24 meeting, in line with expectations. The RBA signalled it would monitor inflation risks, but Governor Michele Bullock downplayed any imminent rate hikes, noting that a rate increase wasn’t seriously considered.
Markets are currently pricing in a 55% chance of a 25-basis-point rate cut by year-end. The RBA is expected to be among the last G10 central banks to cut rates, with reductions likely later this year due to weak economic activity that is expected to ease inflationary pressures.
While Federal Reserve rate cuts are already factored into the market, AUD/USD could see further gains in 2024, though uncertainties surrounding China’s economy and its stimulus measures linger.
In terms of data, Australia’s Ai Group Industry Index improved to -18.6 in September.
AUD/USD daily chart
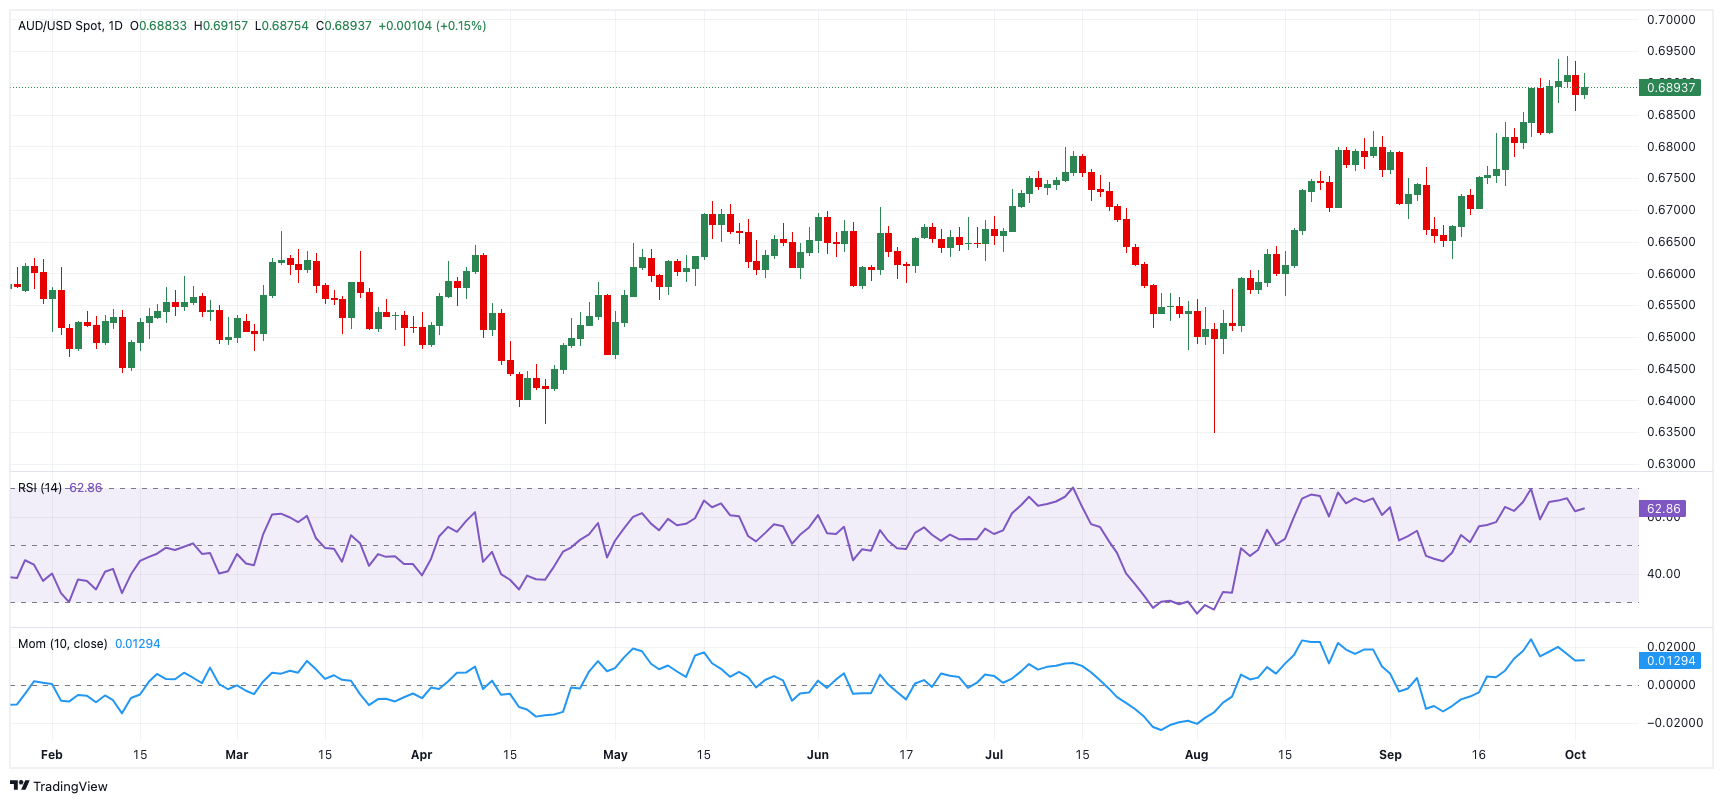
AUD/USD short-term technical outlook
Further upside could see AUD/USD retest its 2024 peak of 0.6942 (September 30) before challenging the critical 0.7000 level.
On the other side, there is early contention around the September low of 0.6622 (September 11), which is supported by the significant 200-day SMA (0.6626), before hitting the 2024 bottom of 0.6347 (August 5).
The four-hour chart indicates the resumption of the bullish trend. Having said that, the initial resistance is 0.6942, which precedes 0.7024. On the downside, the initial support level is 0.6856, followed by 0.6817. The RSI eased to around 48.
Premium
You have reached your limit of 3 free articles for this month.
Start your subscription and get access to all our original articles.
Author

Pablo Piovano
FXStreet
Born and bred in Argentina, Pablo has been carrying on with his passion for FX markets and trading since his first college years.


