AUD/USD Price Forecast: Further upside looks at the Fed
- AUD/USD traded in a vacillating mood past the 0.6700 barrier.
- The Dollar managed to regain an upside impulse on firmer US data.
- Next on tap in Oz will be the Westpac Leading Index.

The renewed bid stance in the US Dollar (USD) keeps the price action in the risk-sensitive space under some pressure, with AUD/USD navigating a narrow range above the 0.6700 hurdle on Tuesday. That said, the Aussie Dollar managed to maintain the auspicious start to the week despite the bounce in the Greenback.
However, AUD still faces challenges from occasional strength in the Greenback and ongoing worries about China’s economic performance.
Tuesday’s small advance in the pair coincided with a knee-jerk in copper prices, although iron ore prices saw a slight rebound. Given that iron ore is closely linked to China's housing and industrial sectors, this weakness could limit the Australian Dollar's gains in the short-term and medium-term horizon.
In the meantime, the current monetary policy stance from the Reserve Bank of Australia (RBA) also helped keep the uptrend in the Australian currency in place. That said, the RBA held the Official Cash Rate (OCR) steady at 4.35% in August, adopting a cautious approach amid persistent inflation. The latest RBA Minutes also came on the hawkish side and indicated discussions about potentially raising the cash rate target, highlighting ongoing inflation concerns and market expectations for rate cuts in late 2024.
In further comments, RBA Governor Michelle Bullock reiterated her cautious approach, warning of high inflation risks and suggesting that rate cuts aren't likely in the near term. Nevertheless, futures indicate an approximately 85% chance of a 25 bps cut by year-end, making the RBA likely the last among G10 central banks to initiate rate cuts.
With the Federal Reserve expected to implement rate cuts that are largely priced in and the RBA anticipated to maintain a restrictive policy for a while, AUD/USD could see further gains later this year.
Yet, the slow recovery of the Chinese economy remains a significant headwind. Deflation and insufficient stimulus are hindering China’s post-pandemic rebound, and the latest Politburo meeting, while supportive, did not unveil any major new stimulus measures, raising concerns about demand from the world's second-largest economy.
Additionally, the latest CFTC report for the week ending September 10 showed that speculative net shorts in the Australian currency reached two-week highs amid a rebound in open interest. Since Q2 2021, the AUD has mostly remained in net short territory, with only a brief period of net long positioning earlier this year.
Looking ahead, the next key data release for Australia will be the Leading Index gauged by Westpac on September 18.
AUD/USD daily chart
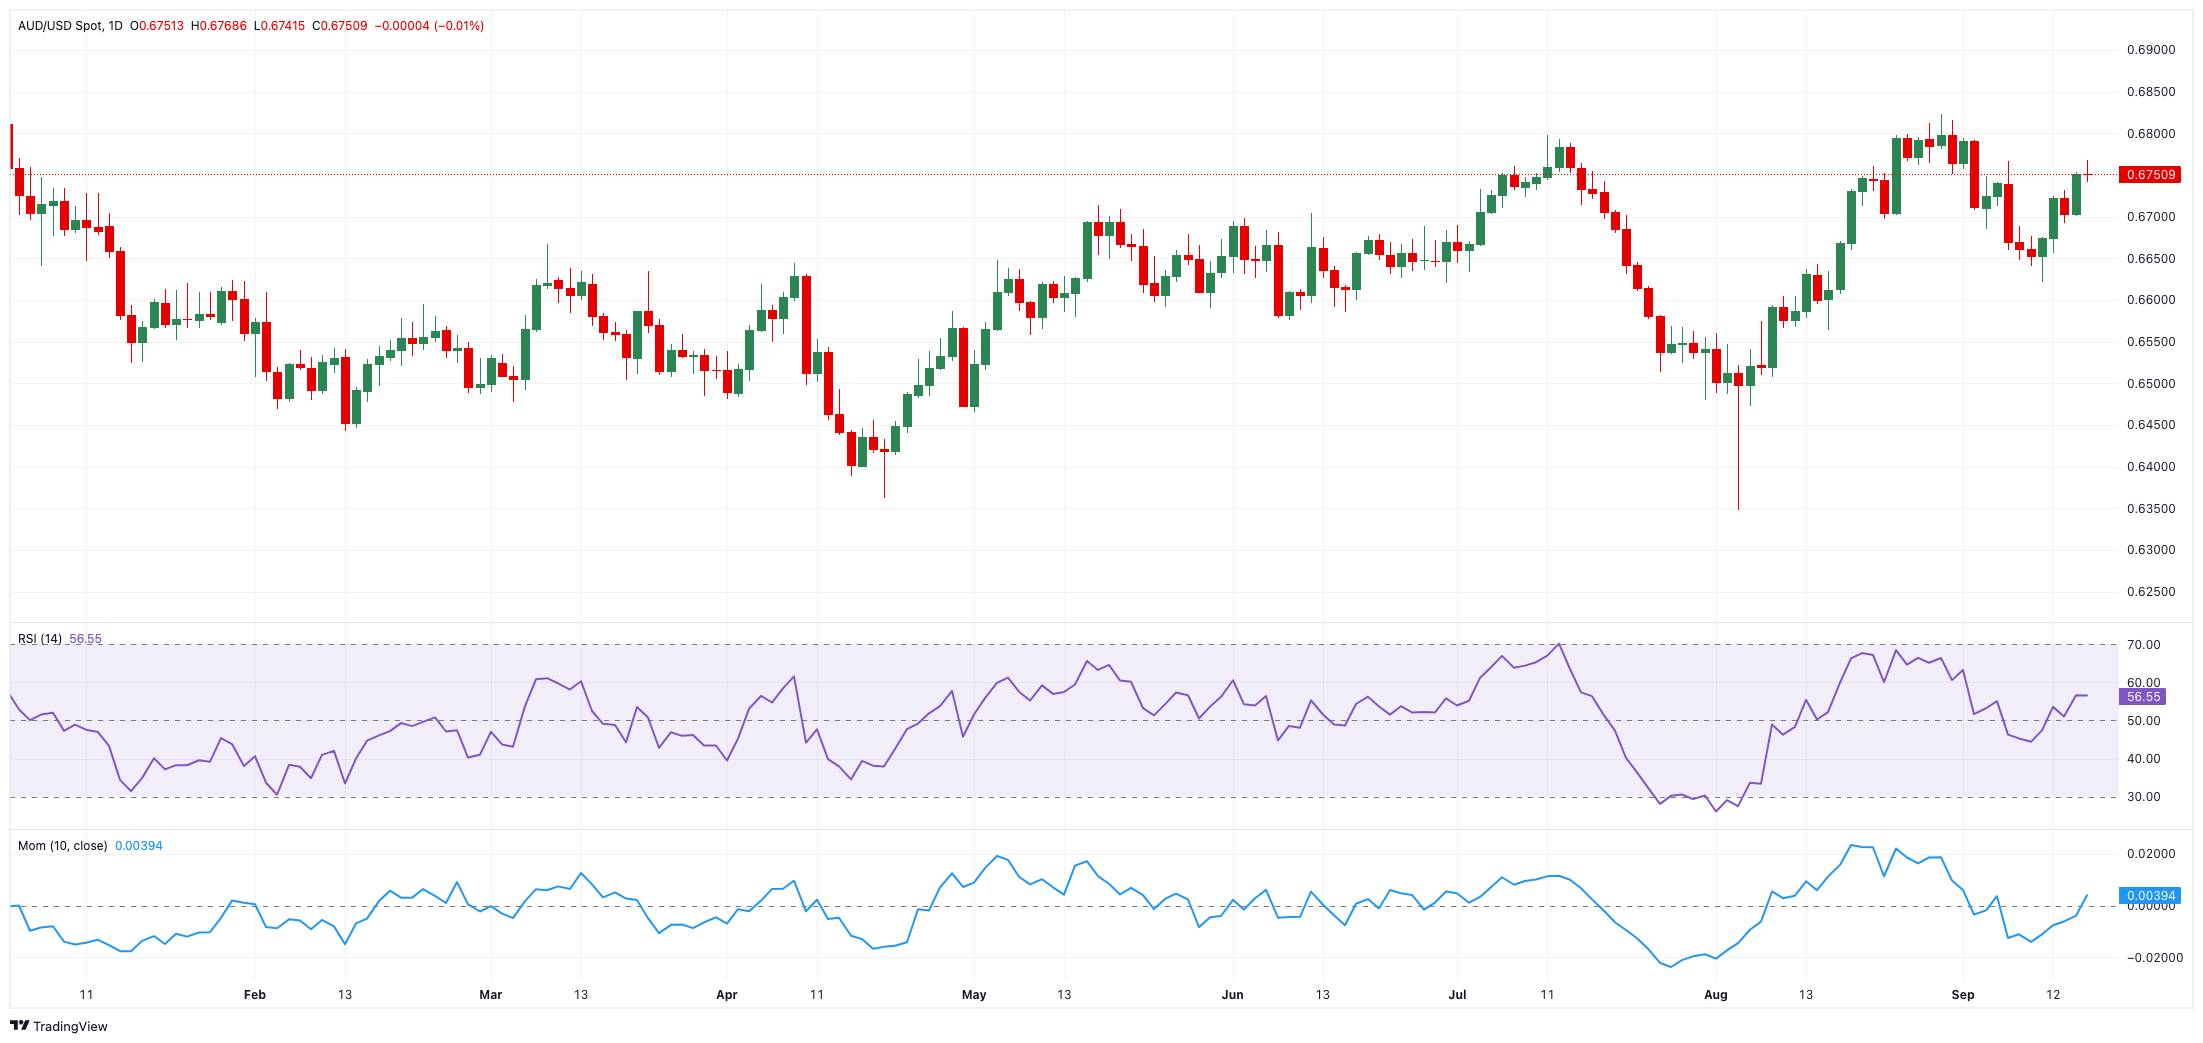
AUD/USD short-term technical outlook
Further gains are expected to propel the AUD/USD to its August top of 0.6823 (August 29), seconded by the December 2023 peak of 0.6871 (December 28), and eventually to the important 0.7000 hurdle.
Sellers, on the other hand, may push the pair below its September low of 0.6622 (September 11), which is propped up by the key 200-day SMA at 0.6619. Down from here is the 2024 bottom of 0.6347 (August 5).
The four-hour chart indicates a further strengthening of the bullish stance. That being said, 0.6768 emerges as the initial up-barrier, followed by 0.6823. On the downside, the preliminary 55-SMA is at 0.6701, before the 200-SMA at 0.6675 and finally 0.6622. The RSI hovered above 62.
Premium
You have reached your limit of 3 free articles for this month.
Start your subscription and get access to all our original articles.
Author

Pablo Piovano
FXStreet
Born and bred in Argentina, Pablo has been carrying on with his passion for FX markets and trading since his first college years.


