AUD/USD Price Forecast: Further losses are likely below the 200-day SMA
- AUD/USD resumed its downtrend and revisited the area below 0.6550.
- The US Dollar traded in a vacillating fashion post-US PCE data.
- Retail Sales in Australia disappointed expectations in September.

The selling pressure returned to the Aussie Dollar on Thursday, prompting AUD/USD to rapidly leave behind Wednesday’s bullish attempt to the boundaries of the key hurdle at 0.6600 the figure.
Following the current price action, spot remains below the critical 200-day Simple Moving Average (SMA) at 0.6627. Such scenario is expected to favour the continuation of the downside trend, at least in the short-term horizon.
The resurgence of the bearish trend in the Australian dollar (AUD) was aided by humble gains in the US dollar (USD) amidst lower US yields across the board and steady prudence ahead of Friday’s Nonfarm Payrolls (NFP).
Also contributing to the selling impulse in AUD, scepticism over the impact of China’s recent stimulus measures remained well in place, while unconvincing results from China’s NBS PMIs added to this view.
Meanwhile, further weakness in copper prices and iron ore prices reflected mixed market sentiment regarding China’s economic outlook, keeping the Australian currency depressed.
Recent Australian data showed the Reserve Bank of Australia’s (RBA) Monthly CPI Indicator rising by 2.1% in September, down from 2.7%. The annual inflation rate for the third quarter increased by 2.8%, while the RBA’s Trimmed Mean CPI rose by 3.5% year-over-year, down from 4.0%. Though disinflationary trends are emerging, they may not be enough for the RBA to begin easing its policy cycle just yet.
In fact, the RBA is largely expected to maintain its official cash rate (OCR) unchanged at 4.35% at its upcoming meeting on November 5.
The market currently assigns only a 15% probability to a 25-basis-point cut by December, while a rate cut in February is priced at under 50%. All in all, the RBA likely to be among the last G10 central banks to lower rates as growth and inflation moderate.
While potential rate cuts by the Federal Reserve later this year could support AUD/USD, lingering uncertainty over China’s economic outlook may keep downward pressure on the pair.
AUD/USD daily chart
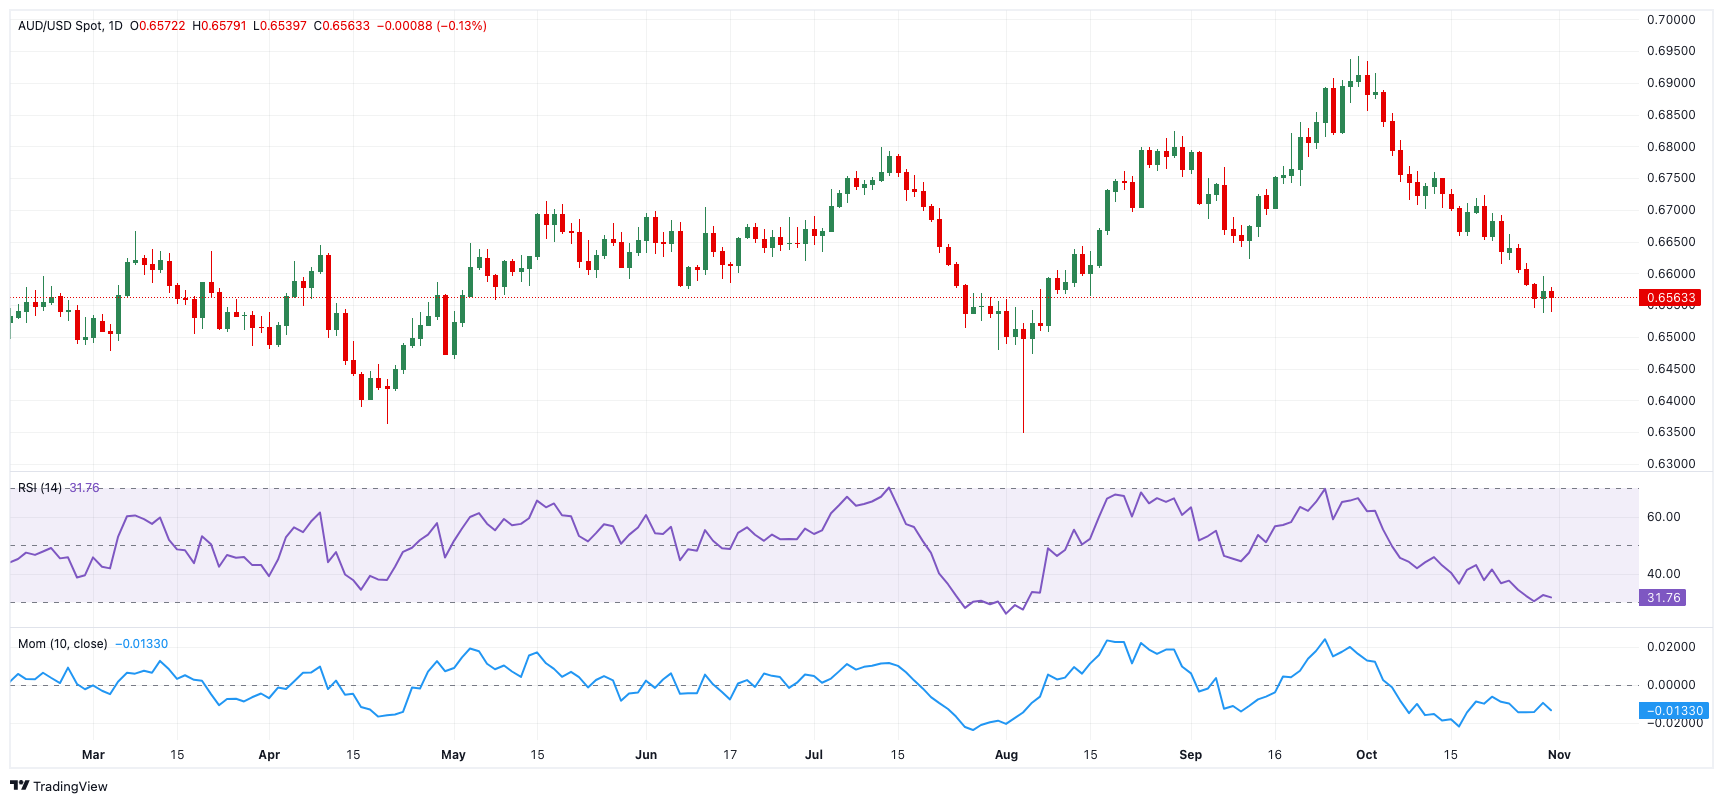
AUD/USD short-term technical outlook
Extra losses might push the AUD/USD to its October low of 0.6536 (October 30), ahead of the 2024 bottom of 0.6347 (August 5).
On the upside, intermediate resistance is at the 200-day SMA of 0.6627, followed by the interim 100-day and 55-day SMAs of 0.6692 and 0.6737, respectively, before reaching the 2024 peak of 0.6942 (September 30).
The four-hour chart reveals an incipient consolidation formation. The initial support is 0.6536, followed by 0.6347. On the upside, the initial resistance level is the 55-SMA at 0.6620, seconded by the 100-SMA at 0.6662, and ultimately 0.6723. The RSI hovered around 41.
Premium
You have reached your limit of 3 free articles for this month.
Start your subscription and get access to all our original articles.
Author

Pablo Piovano
FXStreet
Born and bred in Argentina, Pablo has been carrying on with his passion for FX markets and trading since his first college years.


