As equity markets remain fearful, forex is relatively stable

Market Overview
Fear is a terrible affliction in markets. Right now there is a fear that inflation is showing signs of running away in major economies and there will need to be a response by major central banks to combat the negative impact. Suddenly the market is waking up to the fact that the era of ultra-loose monetary policy is over. The Bank of England does not normally garner too much attention outside the shores of the UK, however in signalling the need to hike rates sooner and possibly for longer in order to combat the impact of inflation, this is yet another central bank positioning itself for tightening quicker than the market had anticipated. However, the fear has been most keenly felt in equity markets which have for so long been the major beneficiaries of loose monetary policy. The big headline move was a four figure drop for the Dow into the close last night (in percentage terms just over 4%). Safe haven assets have benefited, with the yen and gold positive. However the interesting move is a lack of real drama on Treasuries. Perhaps this is because every time yields start to rise, the fear floods into equity markets and subsequently the safe haven status of Treasuries leads to investors buying bonds again. However, this is meaning a relatively stable reaction across major forex pairs. This morning we see risk sentiment actually improving again, with the euro and sterling higher, the commodity currencies also finding a degree of support, whilst the yen is weaker. Overnight, in Congress the Senate has passed the short term funding bill that should help to avert the US government shutdown, whilst it is interesting to see European markets mixed rather than drastically lower in early moves. Chinese inflation was fairly much in line, save for a slight miss on the PPI overnight, but that meant inflation is still falling in China . China CPI dropped to +1.5% (+1.5% exp, +1.8% last) with the China PPI at +4.3% (+4.4% exp, +4.9% last).

Wall Street had another day of precipitous selling with the Dow dropping 1032 ticks, and the S&P 500 -3.8% at 2581. Asian markets followed suit with sharp losses across the board (Nikkei -2.3%), however European markets seem to be holding up relatively well so far, only marginally lower in early moves as US futures suggest a bounce of over 1% currently. In forex, there is actually a reasonable degree of support for positive sentiment, with the yen and the Swiss franc both underperforming, whilst commodity currencies are doing well. In commodities, gold is stable, whilst oil remains under corrective pressure, down over half a percent again.
The market focus for the day comes largely with the UK Industrial Production numbers at 0930GMT, with the December monthly expected to fall by -0.9% which would drag the year on year data back to +0.3% (from +2.5%) which would continue the recent decline and would be the lowest since April 2016. Canadian Unemployment is at 1330GMT which is expected to show the rate ticking slightly higher to 5.8% (from 5.7%). Watch out also for the comments from the Bank of England’s MPC member Jon Cunliffe who is speaking at 1645GMT.
Chart of the Day – EUR/NZD
The euro seems to be positioning for strength against the commodities currencies (the Aussie and Kiwi). On EUR/NZD for the past few weeks the euro has struggled to breakout above 1.7080 which has become a key pivot level. The market tested it last week only to pull back, whilst also once more the market tested the resistance during yesterday’s session. An intraday pullback prevented a breakout, but the bulls are increasingly gaining control at higher levels and the market is poised for a move. Early gains today add to this assertion. A small uptrend channel is in process now with a series of higher lows, the latest of which have been at 1.6780 and this week at 1.6840. Momentum indicators are finding more positive configuration, with the 45/50 area having previously been an area where resistance had formed during December and January, is now an area where the bulls look to return. The hourly chart suggests that there is still a ranging look to the market but a positive bias within the range. This all suggests continued pressure on 1.7080. Initial support today comes in at 1.6915 with corrections within the uptrend channel seen as a chance to buy. A breakout above 1.7080 opens 1.7265/1.7480.

EUR/USD
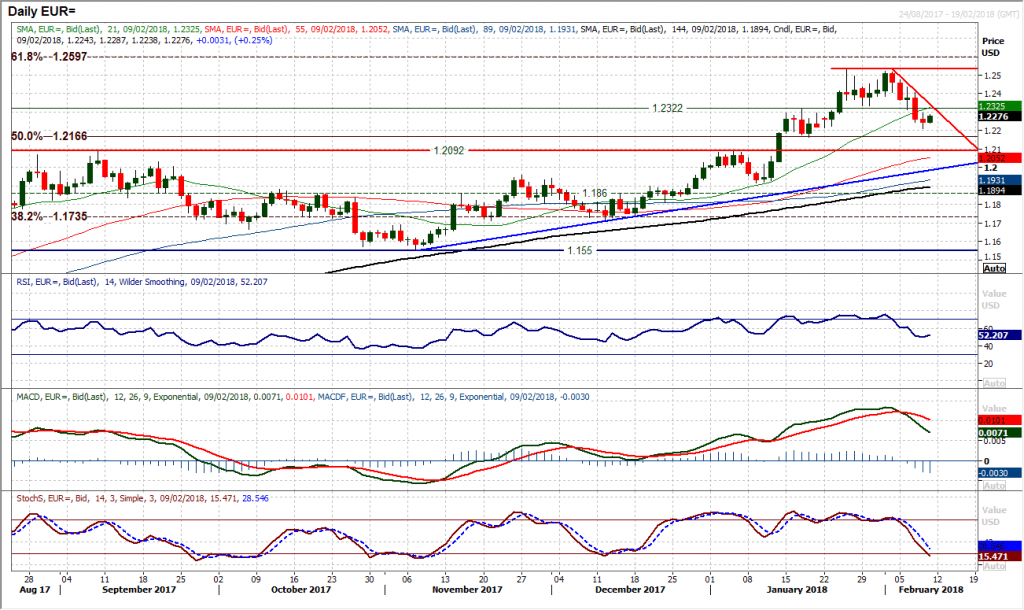
For all the fear flooding through equity markets right now, the dollar did not make much of a move yesterday. After the recent selling pressure has dragged EUR/USD back from the highs of $1.2535 with a series of strong negative candles, yesterday’s session was relatively sedate. A mild negative candle continues the corrective move on the pair, which since the breakdown below support at $1.2320 now implies a corrective move back to around $1.2130. The momentum indicators also point to this correction but are hardly precipitously falling, with the RSI actually settling in the past few sessions around 50. This remains a near term correction within what is likely to be a medium term buying opportunity, with the 3 month uptrend down at $1.1985. The hourly chart shows the hourly RSI failing consistently around 55/60 and MACD failing under neutral which reflects the near term selling into strength outlook. Initial support is now $1.2210, with $1.2295 resistance early today.
GBP/USD
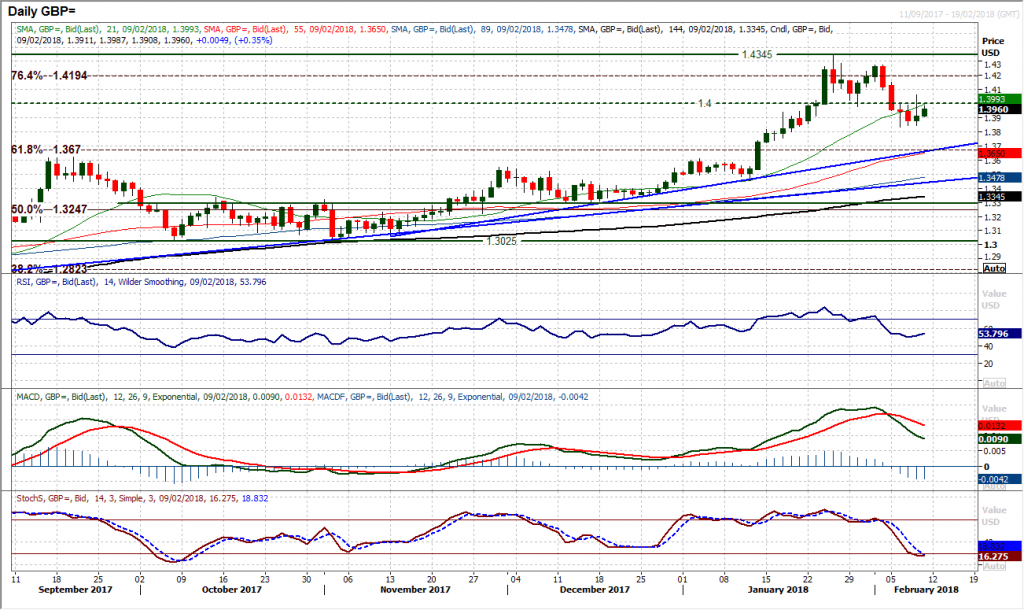
Volatility, on an intraday basis, remains high. The Average True Range on Cable is currently 163 pips and following on from yesterday’s 220 pip daily low to high range, Cable remains jumpy. Despite the fact that the pair closed 150 pips off the day high, there are still signs of gradual improvement. This comes with higher lows in the past two sessions and momentum indicators picking up (RSI and Stochastics). There is a pivot around $1.3975/$1.4000 which remains important near term and it is interesting to see that the sterling bulls are gradually looking to reassert themselves early today. A push higher to test the pivot band will be key for the outlook. Yesterday’s move higher hit $1.4065 before selling off, so this is a key level for the bulls to now breach. The hourly chart shows are more positive configuration on momentum indicators, with $1.3875 initial support now, above $1.3835/$1.3845 which is a key floor near term.
USD/JPY
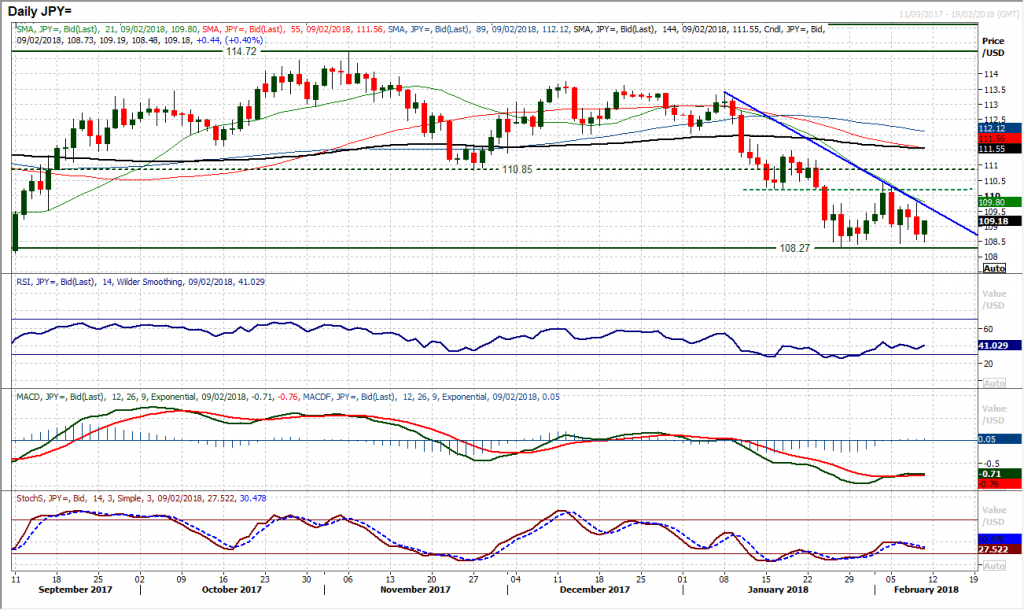
The renewed selling pressure on equity markets saw traders herding back into safer haven plays yesterday and the yen came out as a big winner on the day. This shifted the sentiment, resulting in a 130 pip swing back lower and put on hold the prospect of a decisive dollar bounce against the yen. However, all is not yet lost as the key near term support above 108.27 remains intact. The market has hit a low of 108.48 this morning, but then bounced again. It is interesting to see how the momentum indicators are somewhat mixed on this phase of trading. This means that questions remain unanswered on the sustainability of the support, yet the bulls are still hanging on, even in the face of such fear in other financial markets. The hourly chart shows the market is now ranging between 108.27 and the pivot around 109.75, but with momentum indicators swinging higher again, this range looks set to continue today. The support is hanging on, for now.
Gold
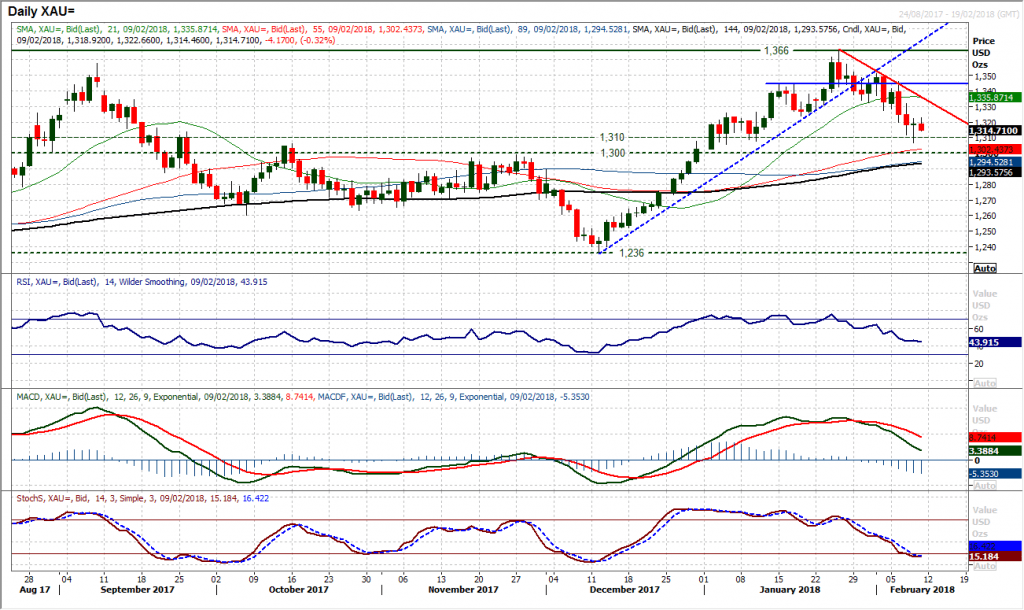
The importance of the long term pivot band at $1300/$1310 is key for the medium term outlook. For now this is a corrective move that under stable market conditions will be eyed by the bulls as an opportunity to buy again. However the reaction to the support band $1300/$1310 could be an outlook defining move. Yesterday’s bounce from $1307 was the first test that has been passed, with the market arguably forming a supportive candle, not far from being a bull hammer. Can this support continue to hold? The hourly chart shows the market unwinding to levels where the buyers have struggled in recent sessions, so the reaction around here will be interesting today. The hourly RSI is around 60 and hourly MACD lines around neutral. Holding a move above $1320 would be encouraging for the bulls whilst a move above $1332 would be a positive breakout that would then open $1344. This could be a crossroads moment. A failure around $1320 would put pressure back on $1300/$1310.
WTI Oil
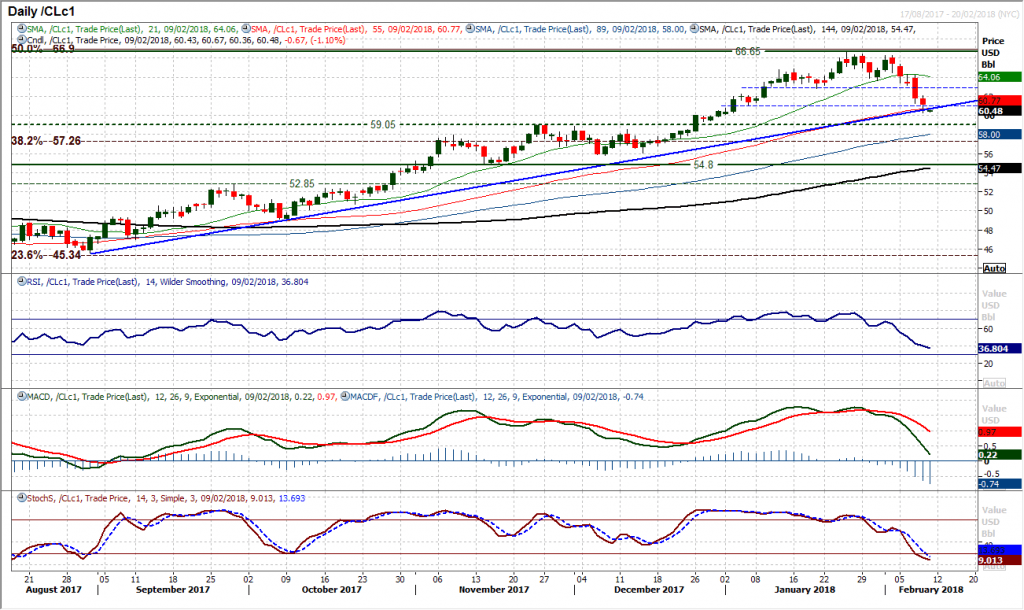
Oil has continues to drop back and is now testing the five month uptrend after another negative candle was formed yesterday. The trend support is in at $60.70 today, whilst the 50 day moving average is also flanking the trend line and has been a significant basis of support in the past 5 months. The momentum indicators suggest that this has still just been a corrective move within a bull trend, an unwinding move and should ultimately provide a buying opportunity again. However support needs to start forming soon as a move below the latest key breakout at $59.05 would be a concern now. The bulls will be concerned with the corrective configuration on the hourly chart and the resistance now built up around $63.00, whilst hourly RSI is failing in the mid-50s as intraday rallies continue to be sold into. It would need a move above $64.30 to regenerate a more positive outlook now.
Dow Jones Industrial Average
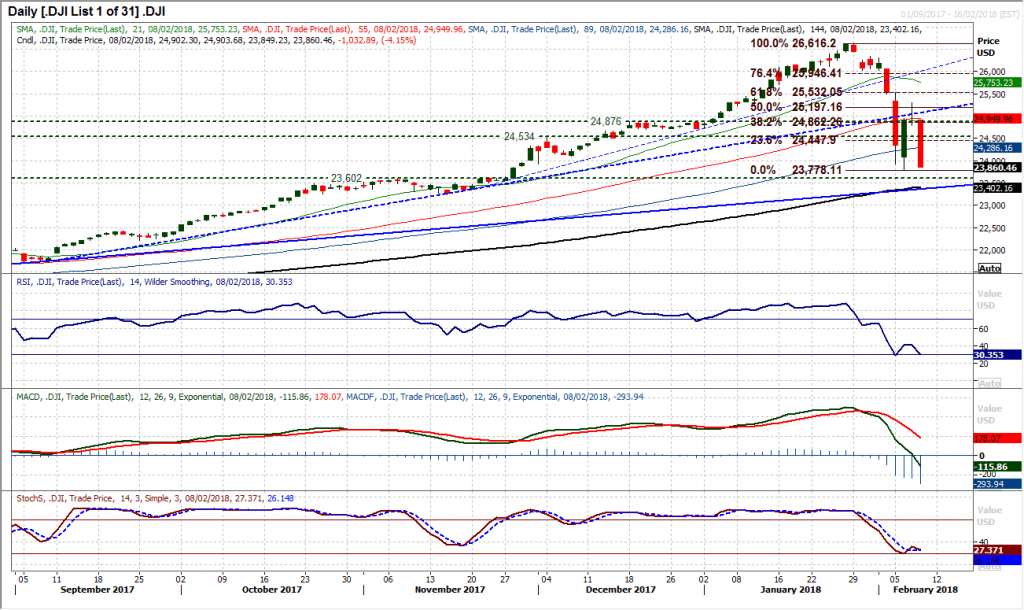
The dead cat bounce has been used as an opportunity to sell, and sell the market certainly did! A second session this week has seen over 1000 ticks of downside as fear flooded through the market which opened almost bang on the day high and closed just 10 ticks off the day low. The one consolation is that the traded low from Tuesday, at 23,779, remains intact, at least for now. The wild ride on Wall Street shows little sign of letting up though and the market is clearly in fear mode right now. The Marabuzu Line (mid-point) of yesterday’s massive bear candle comes in around 24,390 and is initial resistance, whilst the 23.6% Fibonacci retracement of the 26,616/23,778 sell-off comes in at 24,448 and is also a basis of resistance now. The hourly chart shows a negative configuration and rallies are clearly being sold into. The rebound high at 25,294 is now key resistance, whilst a breach of support at 23,779 opens the November low at 23,243.
Author

Richard Perry
Independent Analyst
Richard Perry, Independent Market Analyst, has over 20 years of experience working in financial markets in London.


