A correction within a medium-term downtrend?

On the above chart, you can see gold price shown as weekly candlesticks.
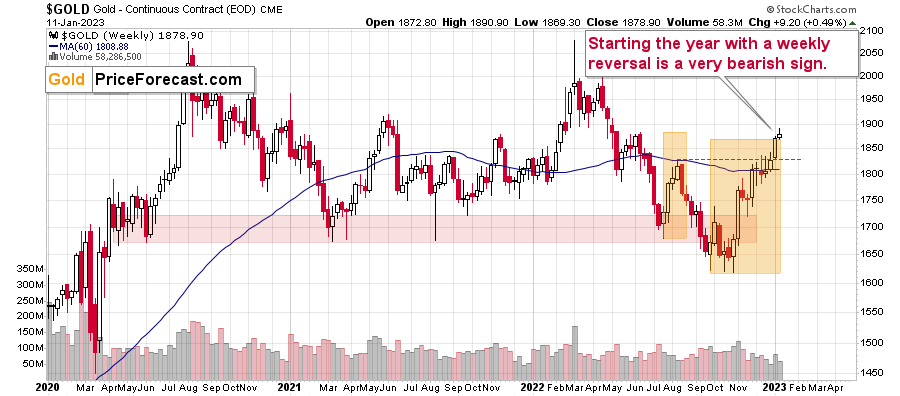
Gold recently moved above its August highs, but stopped – approximately – at its June highs. This doesn’t have to be the top, but it’s quite likely to be one, especially that gold recently moved quite close to the most prominent of its Fibonacci retracement levels – the 61.8% one. But you’ll see that more clearly on the following short-term gold chart. For now, I would like you to note the shape of this week’s gold performance so far.
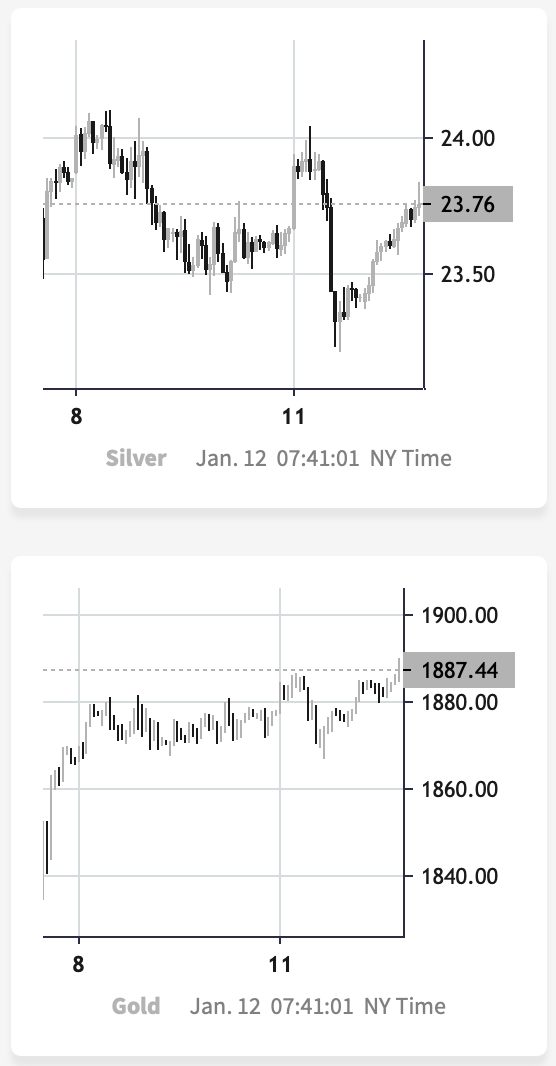
Gold reversed. This might not be something very important per se, because there are two more sessions this week, however, when one compares it to the performance of silver and junior mining stocks (GDXJ) that both declined so far this week, it becomes something that should make gold bulls concerned.
On the chart below, you can see that while gold moved slightly above its recent short-term highs, silver is far from doing the same thing. In fact, silver has serious problems with staying above the $24 level.
The orange rectangles on the previous chart represent the corrective upswings from approximately the previous local lows. There are two of them, and back in 2013, there was just one corrective upswing, before gold truly plunged.
However, please remember that history doesn’t repeat itself to the letter – it rhymes. This means that two corrections instead of one are still within the scope of the similarity, especially that the first correction wasn’t as big as the 2008 one.
The current situation is truly special, as the rate hikes are something that we haven’t seen in a long time. The same goes for the level of concern about the inflation that’s “out there”. The latter implies that when faced with a decision whether to fight inflation or help the economy, the Fed is likely to lean toward the former. And that’s bearish for assets like gold.
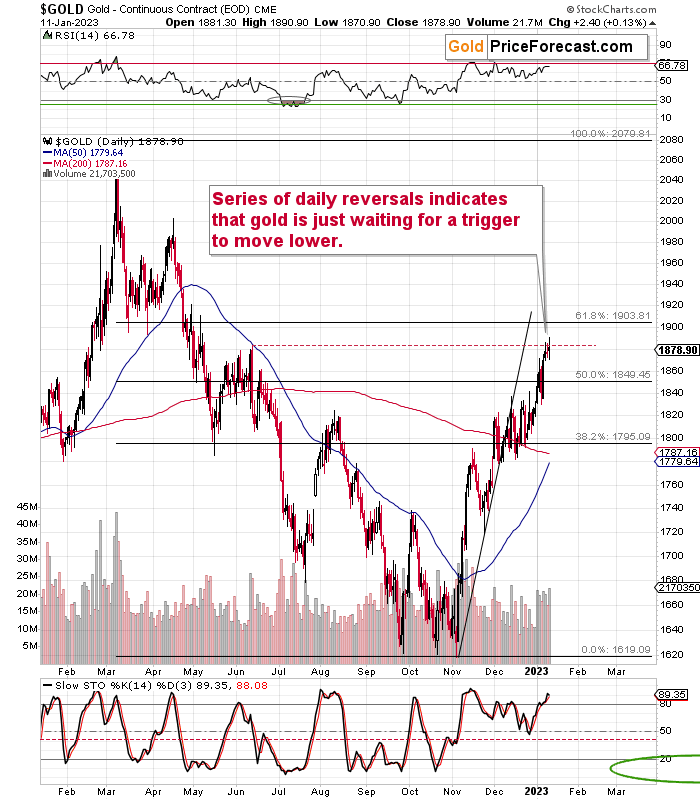
Series of daily reversals indicates that gold is just waiting for a trigger to move lower.
The RSI indicator is trading very close to 70, which means that it’s pointing to a condition that’s not yet clearly overbought, but it’s close to being overbought.
If gold moved higher and reached its 61.8% Fibonacci retracement level, then the odds are that the RSI would move to the 70 level, thus creating a very convincing sell signal.
The above is actually what could happen as the markets overreact to the CPI numbers that are released today, regardless of what the numbers actually are.
However, does gold need this to happen before declining?
It doesn’t.
Gold moved slightly above its June 2022 high and then it moved back below it. That’s an invalidation of a breakout, which by itself is a bearish indication. The fact that we saw several intraday reversals recently makes it even more likely that gold moves lower in the near term.
Want free follow-ups to the above article and details not available to 99%+ investors? Sign up to our free newsletter today!
Want free follow-ups to the above article and details not available to 99%+ investors? Sign up to our free newsletter today!
Author

Przemyslaw Radomski, CFA
Sunshine Profits
Przemyslaw Radomski, CFA (PR) is a precious metals investor and analyst who takes advantage of the emotionality on the markets, and invites you to do the same. His company, Sunshine Profits, publishes analytical software that any


