|

WTI Price Analysis: Sticks to modest gains around mid-$82.00s, upside potential seems limited

  • WTI gains some positive traction on Tuesday and recovers a part of the precious day’s slide.
  • The technical setup favours bearish traders and supports prospects for a further downfall.
  • Any positive move back above the $83.00 mark is likely to get sold into and remain capped.

West Texas Intermediate (WTI) Crude Oil prices attract some buying on Tuesday and move away from a near three-week low, around the $81.55 region touched the previous day. The commodity sticks to its modest intraday gains through the first half of the European session and currently trades around mid-$82.00s, up 0.25% for the day.

Worries that a further escalation in the Israel-Hamas conflict could disrupt oil supplies from the Middle East turn out to be a key factor lending some support to the black liquid. The upside, however, remains capped in the wake of the worsening economic conditions in China – the world's top oil importer – and headwinds stemming from rapidly rising borrowing costs, which could dent fuel demand.

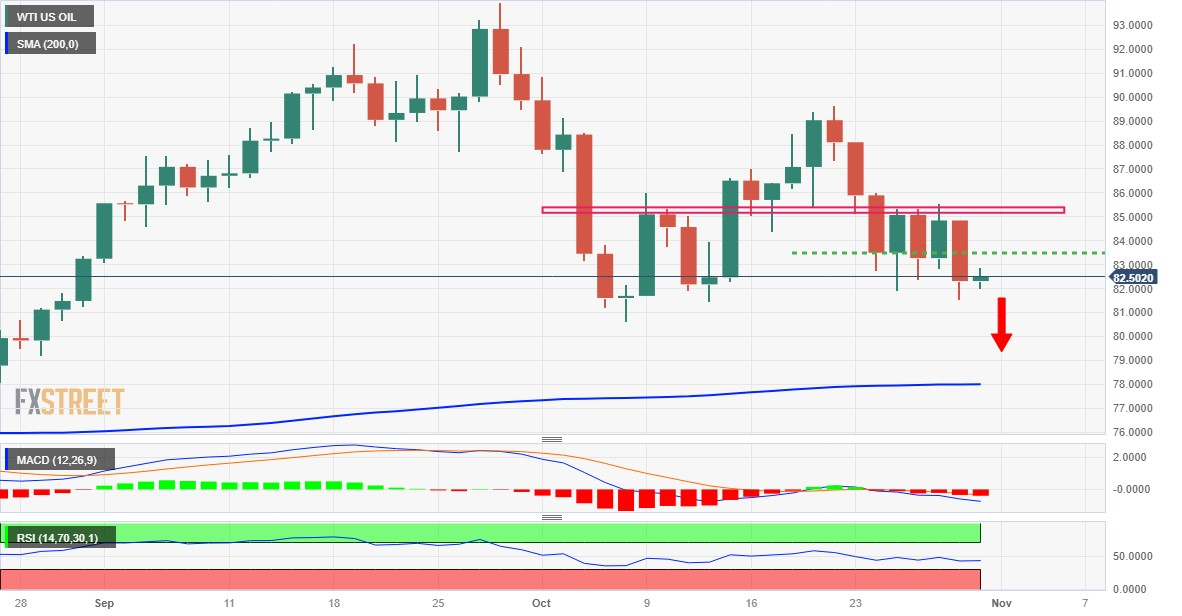
From a technical perspective, the overnight sharp decline and a close below the $83.50-$83.30 horizontal support could be seen as a fresh trigger for bearish traders. Moreover, oscillators on the daily chart have just started drifting into the negative territory and suggest that the path of least resistance for Oil prices is to the downside. Hence, any subsequent move up is more likely to get sold into.

The $83.00 round figure, followed by the $83.30-$83.50 support breakpoint now seems to act as an immediate strong barrier. A sustained strength beyond, however, could lift Oil prices beyond the $84.00 mark, towards the $84.70 intermediate hurdle en route to the $85.00 psychological mark. The next relevant resistance is pegged near the mid-$85.00s, which if cleared will negate the bearish outlook.

On the flip side, the $82.00 round figure is likely to protect the immediate downside ahead of the overnight swing low, around the $81.55 region. Some follow-through selling will be seen as a fresh trigger for bearish traders and make Oil prices vulnerable to weaken further below the $81.00 mark. The downward trajectory could eventually drag the commodity towards the monthly low, around the $80.65 region.

WTI daily chart

fxsoriginal

Technical levels to watch

WTI US OIL

Overview
Today last price82.52
Today Daily Change0.21
Today Daily Change %0.26
Today daily open82.31
 
Trends
Daily SMA2084.86
Daily SMA5085.84
Daily SMA10080.85
Daily SMA20077.99
 
Levels
Previous Daily High84.85
Previous Daily Low81.55
Previous Weekly High88.12
Previous Weekly Low81.91
Previous Monthly High93.98
Previous Monthly Low83.09
Daily Fibonacci 38.2%82.81
Daily Fibonacci 61.8%83.59
Daily Pivot Point S180.96
Daily Pivot Point S279.6
Daily Pivot Point S377.66
Daily Pivot Point R184.26
Daily Pivot Point R286.2
Daily Pivot Point R387.56

Author

Haresh Menghani

Haresh Menghani is a detail-oriented professional with 10+ years of extensive experience in analysing the global financial markets.

More from Haresh Menghani
Share:

Markets move fast. We move first.

Orange Juice Newsletter brings you expert driven insights - not headlines. Every day on your inbox.

By subscribing you agree to our Terms and conditions.

Editor's Picks

EUR/USD drops to daily lows near 1.1630

EUR/USD now loses some traction and slips back to the area of daily lows around 1.1630 on the back of a mild bounce in the US Dollar. Fresh US data, including the September PCE inflation numbers and the latest read on December consumer sentiment, didn’t really move the needle, so the pair is still on course to finish the week with a respectable gain.

GBP/USD trims gains, recedes toward 1.3320

GBP/USD is struggling to keep its daily advance, coming under fresh pressure and retreating to the 1.3320 zone following a mild bullish attempt in the Greenback. Even though US consumer sentiment surprised to the upside, the US Dollar isn’t getting much love, as traders are far more interested in what the Fed will say next week.

Gold makes a U-turn, back to $4,200

Gold is now losing the grip and receding to the key $4,200 region per troy ounce following some signs of life in the Greenback and a marked bounce in US Treasury yields across the board. The positive outlook for the precious metal, however, remains underpinned by steady bets for extra easing by the Fed.

Crypto Today: Bitcoin, Ethereum, XRP pare gains despite increasing hopes of upcoming Fed rate cut

Bitcoin is steadying above $91,000 at the time of writing on Friday. Ethereum remains above $3,100, reflecting positive sentiment ahead of the Federal Reserve's (Fed) monetary policy meeting on December 10.

Week ahead – Rate cut or market shock? The Fed decides

Fed rate cut widely expected; dot plot and overall meeting rhetoric also matter. Risk appetite is supported by Fed rate cut expectations; cryptos show signs of life. RBA, BoC and SNB also meet; chances of surprises are relatively low.

Ripple faces persistent bear risks, shrugging off ETF inflows

Ripple is extending its decline for the second consecutive day, trading at $2.06 at the time of writing on Friday. Sentiment surrounding the cross-border remittance token continues to lag despite steady inflows into XRP spot ETFs.