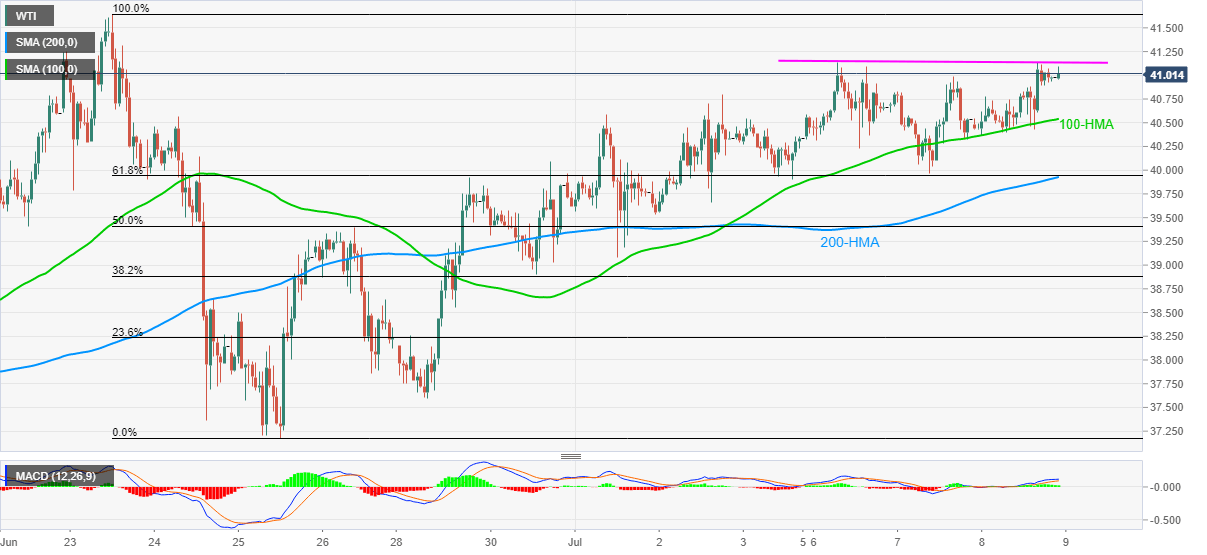
- WTI stays mildly bid above $41.00 while remaining above 100-HMA.
- Multiple failures to cross $41.15 confront a bullish chart formation on a short timeframe.
- June month’s top, February low will be on the buyers’ radar after a successful break.
- Bears are likely to seek entries below $39.90.
WTI seesaws around $41.00 during the pre-Tokyo open on Thursday. Considering the oil benchmark’s repeated failure to overcome $41.15 during the week, coupled with Tuesday’s bounce off $39.96, the rounding bottom bullish chart pattern is clearing coming up on the hourly play. Other than the upside suggesting formation, bullish MACD and the sustained trading beyond 100-HMA also favor the optimists.
Though, a clear break of $41.15 becomes necessary for the bulls to attack June month’s top near $41.65. In a case where the black gold remains positive after crossing the previous month’s high, February’s low around $44.00 will be on their radars.
It’s worth mentioning that December 2018 low near $42.45 can act as an intermediate halt during the rise.
Meanwhile, a confluence of 200-HMA and 23.6% Fibonacci retracement of June 23-25 fall, around $39.90, becomes near-term strong support to watch during the quote’s fresh weakness below 100-HMA immediate rest-point of $40.54.
Should the oil prices decline below $39.90, 50% Fibonacci retracement around $39.40 holds the gate for the quote’s additional downside towards the sub-$38.00 region.
WTI hourly chart
Trend: Bullish
Information on these pages contains forward-looking statements that involve risks and uncertainties. Markets and instruments profiled on this page are for informational purposes only and should not in any way come across as a recommendation to buy or sell in these assets. You should do your own thorough research before making any investment decisions. FXStreet does not in any way guarantee that this information is free from mistakes, errors, or material misstatements. It also does not guarantee that this information is of a timely nature. Investing in Open Markets involves a great deal of risk, including the loss of all or a portion of your investment, as well as emotional distress. All risks, losses and costs associated with investing, including total loss of principal, are your responsibility. The views and opinions expressed in this article are those of the authors and do not necessarily reflect the official policy or position of FXStreet nor its advertisers. The author will not be held responsible for information that is found at the end of links posted on this page.
If not otherwise explicitly mentioned in the body of the article, at the time of writing, the author has no position in any stock mentioned in this article and no business relationship with any company mentioned. The author has not received compensation for writing this article, other than from FXStreet.
FXStreet and the author do not provide personalized recommendations. The author makes no representations as to the accuracy, completeness, or suitability of this information. FXStreet and the author will not be liable for any errors, omissions or any losses, injuries or damages arising from this information and its display or use. Errors and omissions excepted.
The author and FXStreet are not registered investment advisors and nothing in this article is intended to be investment advice.
Recommended content
Editors’ Picks
EUR/USD trades with negative bias, holds above 1.0700 as traders await US PCE Price Index

EUR/USD edges lower during the Asian session on Friday and moves away from a two-week high, around the 1.0740 area touched the previous day. Spot prices trade around the 1.0725-1.0720 region and remain at the mercy of the US Dollar price dynamics ahead of the crucial US data.
USD/JPY jumps above 156.00 on BoJ's steady policy

USD/JPY has come under intense buying pressure, surging past 156.00 after the Bank of Japan kept the key rate unchanged but tweaked its policy statement. The BoJ maintained its fiscal year 2024 and 2025 core inflation forecasts, disappointing the Japanese Yen buyers.
Gold price flatlines as traders look to US PCE Price Index for some meaningful impetus

Gold price lacks any firm intraday direction and is influenced by a combination of diverging forces. The weaker US GDP print and a rise in US inflation benefit the metal amid subdued USD demand. Hawkish Fed expectations cap the upside as traders await the release of the US PCE Price Index.
Sei Price Prediction: SEI is in the zone of interest after a 10% leap

Sei price has been in recovery mode for almost ten days now, following a fall of almost 65% beginning in mid-March. While the SEI bulls continue to show strength, the uptrend could prove premature as massive bearish sentiment hovers above the altcoin’s price.
US economy: Slower growth with stronger inflation

The US Dollar strengthened, and stocks fell after statistical data from the US. The focus was on the preliminary estimate of GDP for the first quarter. Annualised quarterly growth came in at just 1.6%, down from the 2.5% and 3.4% previously forecast.