|

WTI Price Analysis: Risks further falls towards $58 mark whilst below 50-DMA

  • WTI sellers return following rejection at 50-DMA resistance at $60.32.
  • The US oil could risk a drop towards the ascending trendline support at $57.85.
  • RSI trades flat while within the bearish zone, pointing to more losses.  

WTI (futures on NYMEX) is snapping two-day bullish momentum on Thursday, as it returns to the red zone despite the upbeat market mood and broad-based US dollar decline.

The sentiment around the black gold remains undermined by an unexpected build in the American gasoline inventories, which overshadowed the drawdown in the crude stockpiles recorded last week.

From a near-term technical perspective, the WTI barrel remains exposed to the downside after it failed to find acceptance above the 50-daily moving average (DMA) at $60.32 for the third day in a row.

Adding credence to a potential move lower, the 14-day Relative Strength Index (RSI) keeps its bearish streak intact, as the indicator remains below the 50.00 level.

The ascending trendline support at $57.85 is expected to guard the downside, below which the March 23 low of $57.27 could be tested.

WTI one-day chart

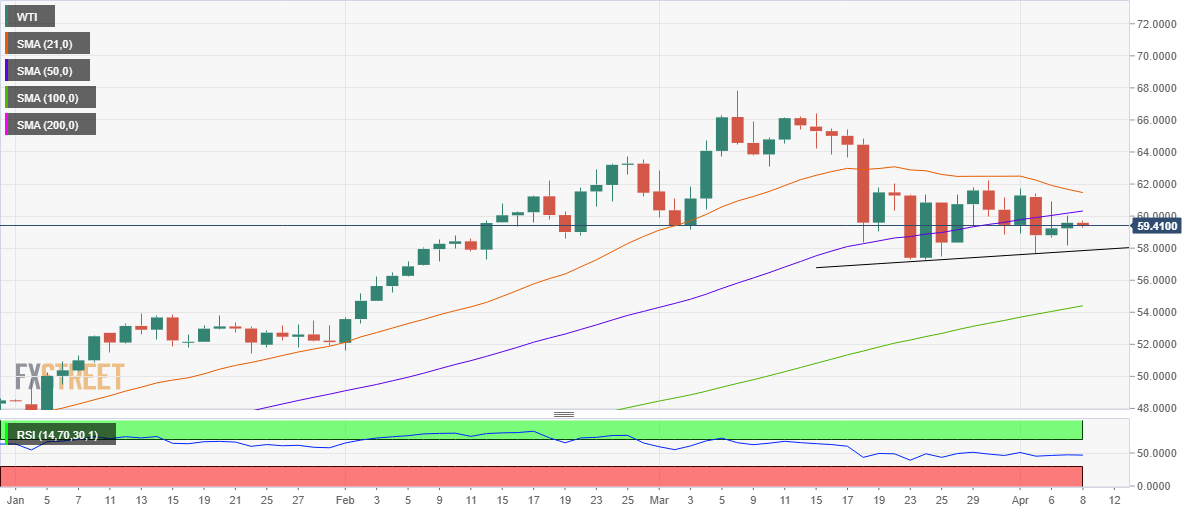
On the flip side, WTI faces immediate resistance at the upward-sloping 50-DMA.

Further up the bearish 21-DMA at $61.46 could limit the recovery attempts.

WTI additional levels

WTI

Overview
Today last price59.31
Today Daily Change-0.19
Today Daily Change %-0.32
Today daily open59.58
 
Trends
Daily SMA2061.57
Daily SMA5060.18
Daily SMA10054.23
Daily SMA20047.4
 
Levels
Previous Daily High60.06
Previous Daily Low58.15
Previous Weekly High62.25
Previous Weekly Low58.88
Previous Monthly High67.87
Previous Monthly Low57.27
Daily Fibonacci 38.2%59.33
Daily Fibonacci 61.8%58.88
Daily Pivot Point S158.47
Daily Pivot Point S257.36
Daily Pivot Point S356.57
Daily Pivot Point R160.38
Daily Pivot Point R261.17
Daily Pivot Point R362.28

Author

Dhwani Mehta

Dhwani Mehta

FXStreet

Residing in Mumbai (India), Dhwani is a Senior Analyst and Manager of the Asian session at FXStreet. She has over 10 years of experience in analyzing and covering the global financial markets, with specialization in Forex and commodities markets.

More from Dhwani Mehta
Share:

Markets move fast. We move first.

Orange Juice Newsletter brings you expert driven insights - not headlines. Every day on your inbox.

By subscribing you agree to our Terms and conditions.

Editor's Picks

EUR/USD climbs toward 1.1800 on broad USD weakness

EUR/USD gathers bullish momentum and advances toward 1.1800 in the second half of the day on Tuesday. The US Dollar weakens and helps the pair stretch higher after the employment report showed that Nonfarm Payrolls declined by 105,000 in October before rising by 64,000 in November.

GBP/USD climbs to fresh two-month high above 1.3400

GBP/USD gains traction in the American session and trades at its highest level since mid-October above 1.3430. The British Pound benefits from upbeat PMI data, while the US Dollar struggles to find demand following the mixed employment figures and weaker-than-forecast PMI prints, allowing the pair to march north.

Gold extends its consolidative phase around $4,300

Gold trades in positive above $4,300 after spending the first half of the day under bearish pressure. XAU/USD capitalizes on renewed USD weakness after the jobs report showed that the Unemployment Rate climbed to 4.6% in November and the PMI data revealed a loss of growth momentum in the private sector in December. 

US Retail Sales virtually unchanged at $732.6 billion in October

Retail Sales in the United States were virtually unchanged at $732.6 billion in October, the US Census Bureau reported on Tuesday. This print followed the 0.1% increase (revised from 0.3%) recorded in September and came in below the market expectation of +0.1%.

Ukraine-Russia in the spotlight once again

Since the start of the week, gold’s price has moved lower, but has yet to erase the gains made last week. In today’s report we intend to focus on the newest round of peace talks between Russia and Ukraine, whilst noting the release of the US Employment data later on day and end our report with an update in regards to the tensions brewing in Venezuela.

BNB Price Forecast: BNB slips below $855 as bearish on-chain signals and momentum indicators turn negative

BNB, formerly known as Binance Coin, continues to trade down around $855 at the time of writing on Tuesday, after a slight decline the previous day. Bearish sentiment further strengthens as BNB’s on-chain and derivatives data show rising retail activity.