|

WTI Price Analysis: Regains $78.00 within weekly rising wedge

  • WTI seesaws inside a choppy range after snapping a three-day uptrend the previous day.
  • Bearish chart formation, and sluggish oscillators keep sellers hopeful.
  • 200-HMA adds to the downside filters before targeting late 2022 low.

WTI crude oil picks up bids to regain $78.00 during early Friday, following its U-turn from a one-week high to print the first daily loss in four on Thursday. It’s worth noting that the black gold’s latest inaction could be linked to sluggish MACD signals and steady RSI (14).

Even so, a one-week-old rising wedge bearish chart formation, currently between $77.30 and $79.30, keeps the Oil sellers hopeful, especially after the previous day’s retreat from the 61.8% Fibonacci retracement level of the quote’s downturn from January 23 to February 03.

That said, a clear downside break of the $77.30 support will need validation from the 200-Hour Moving Average (HMA) support of $76.96 to convince the energy bears.

Following that, the monthly bottom of $72.50 can act as a buffer during the south run targeting the latest multi-month low surrounding $70.30, marked in December 2022. It should be observed that the $70.00 round figure could probe the WTI sellers past $70.30.

Alternatively, WTI recovery could aim for another battle with the aforementioned key Fibonacci retracement hurdle of around $78.80.

Even if the commodity manages to cross the $78.80 hurdle, the stated wedge’s top line, close to $79.30 at the latest, will precede the $80.00 psychological magnet to challenge the quote’s further upside.

Overall, WTI crude oil remains on the bear’s radar despite the latest inaction.

WTI: Hourly chart

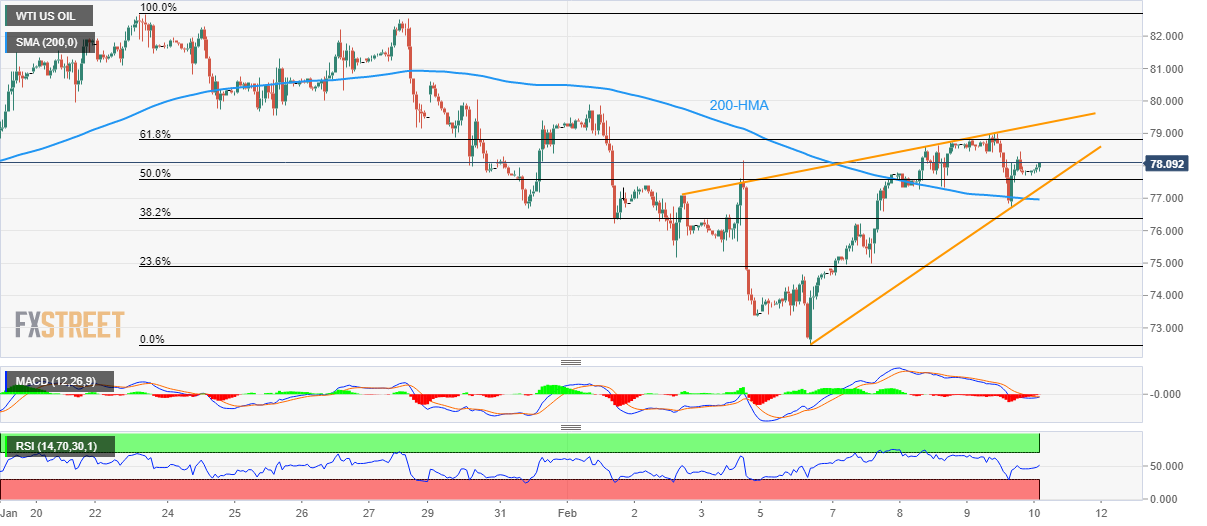
Trend: Further downside expected

Additional important levels

Overview
Today last price77.93
Today Daily Change0.12
Today Daily Change %0.15%
Today daily open77.81
 
Trends
Daily SMA2078.91
Daily SMA5077.47
Daily SMA10080.85
Daily SMA20090.21
 
Levels
Previous Daily High79
Previous Daily Low76.71
Previous Weekly High80.61
Previous Weekly Low73.36
Previous Monthly High82.68
Previous Monthly Low72.64
Daily Fibonacci 38.2%77.59
Daily Fibonacci 61.8%78.13
Daily Pivot Point S176.68
Daily Pivot Point S275.55
Daily Pivot Point S374.39
Daily Pivot Point R178.97
Daily Pivot Point R280.13
Daily Pivot Point R381.26

Author

Anil Panchal

Anil Panchal

FXStreet

Anil Panchal has nearly 15 years of experience in tracking financial markets. With a keen interest in macroeconomics, Anil aptly tracks global news/updates and stays well-informed about the global financial moves and their implications.

More from Anil Panchal
Share:

Markets move fast. We move first.

Orange Juice Newsletter brings you expert driven insights - not headlines. Every day on your inbox.

By subscribing you agree to our Terms and conditions.

Editor's Picks

EUR/USD rebounds after falling toward 1.1700

EUR/USD gains traction and trades above 1.1730 in the American session, looking to end the week virtually unchanged. The bullish opening in Wall Street makes it difficult for the US Dollar to preserve its recovery momentum and helps the pair rebound heading into the weekend.

GBP/USD steadies below 1.3400 as traders assess BoE policy outlook

Following Thursday's volatile session, GBP/USD moves sideways below 1.3400 on Friday. Investors reassess the Bank of England's policy oıtlook after the MPC decided to cut the interest rate by 25 bps by a slim margin. Meanwhile, the improving risk mood helps the pair hold its ground.

Gold stays below $4,350, looks to post small weekly gains

Gold struggles to gather recovery momentum and stays below $4,350 in the second half of the day on Friday, as the benchmark 10-year US Treasury bond yield edges higher. Nevertheless, the precious metal remains on track to end the week with modest gains as markets gear up for the holiday season.

Crypto Today: Bitcoin, Ethereum, XRP rebound amid bearish market conditions

Bitcoin (BTC) is edging higher, trading above $88,000 at the time of writing on Monday. Altcoins, including Ethereum (ETH) and Ripple (XRP), are following in BTC’s footsteps, experiencing relief rebounds following a volatile week.

How much can one month of soft inflation change the Fed’s mind?

One month of softer inflation data is rarely enough to shift Federal Reserve policy on its own, but in a market highly sensitive to every data point, even a single reading can reshape expectations. November’s inflation report offered a welcome sign of cooling price pressures. 

XRP rebounds amid ETF inflows and declining retail demand demand

XRP rebounds as bulls target a short-term breakout above $2.00 on Friday. XRP ETFs record the highest inflow since December 8, signaling growing institutional appetite.