|

WTI Price Analysis: Refreshes nine-month high above $46.00 on bullish flag confirmation

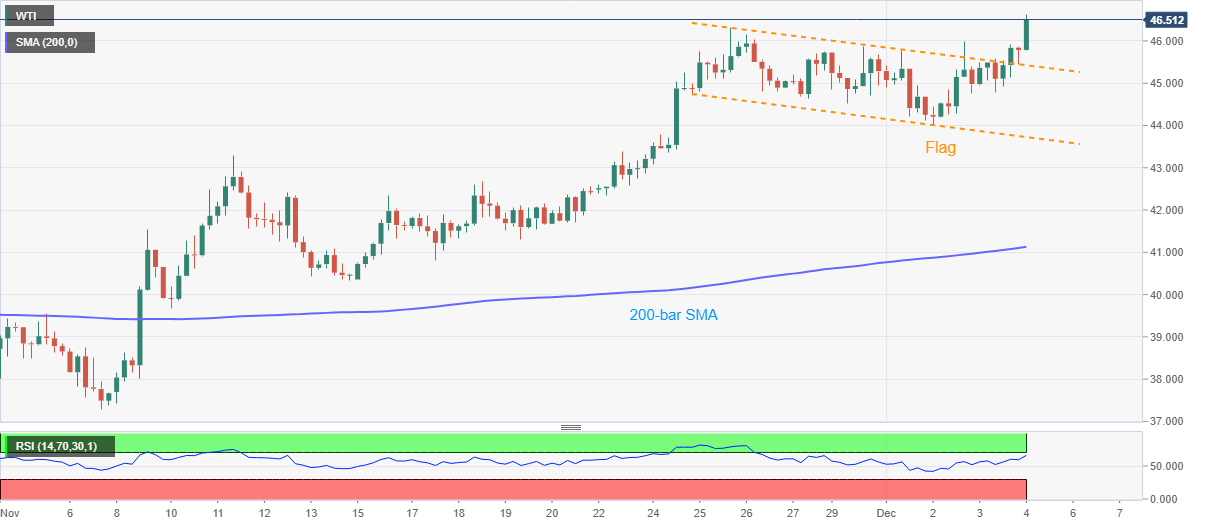
  • WTI seesaws around $46.38-63 after rising to the fresh high since March 2020.
  • Confirmation of the bullish chart pattern, lack of overbought RSI favors the oil buyers.
  • 200-bar SMA offers key support, pullback moves can aim for the early-November top.

WTI picks up the bids near $46.50, up 1.75% intraday, while taking rounds to the nearly 25-pip trading range during early Friday. The energy benchmark recently surged to $46.63, the highest level in months, after confirming the bullish flag chart pattern on the four-hour play.

Not only the confirmation of the bullish formation but absence of the overbought RSI conditions also suggests further increase in the price of the black gold.

As a result, a gradual run-up towards the March 2020 high near $48.70 becomes more expected.

Following that, February low near $49.45 and the $50.00 round-figure will gain the bulls’ attention.

On the downside, pullback moves below the flag’s upper line, at $45.40 now, may revisit the flag’s support, currently around $43.75.

Though, any further weakness below $43.75 will eye the November 11 top near $43.30.

WTI four-hour chart
Trend: Bullish

Additional important levels

Overview
Today last price46.48
Today Daily Change0.76
Today Daily Change %1.66%
Today daily open45.72
 
Trends
Daily SMA2042.88
Daily SMA5040.85
Daily SMA10041.03
Daily SMA20036.68
 
Levels
Previous Daily High45.92
Previous Daily Low44.76
Previous Weekly High46.31
Previous Weekly Low42.34
Previous Monthly High46.31
Previous Monthly Low33.85
Daily Fibonacci 38.2%45.47
Daily Fibonacci 61.8%45.2
Daily Pivot Point S145.01
Daily Pivot Point S244.3
Daily Pivot Point S343.85
Daily Pivot Point R146.17
Daily Pivot Point R246.62
Daily Pivot Point R347.33

Author

Anil Panchal

Anil Panchal

FXStreet

Anil Panchal has nearly 15 years of experience in tracking financial markets. With a keen interest in macroeconomics, Anil aptly tracks global news/updates and stays well-informed about the global financial moves and their implications.


More from Anil Panchal
Share:

Editor's Picks

GBP/USD holds lower ground near 1.3450 on USD rebound

GBP/USD trades in negative territory around 1.3450 in the European trading hours on Friday. Heightened Middle East tensions and rising global oil prices provide some support for the safe-haven US Dollar (USD), weighing on the pair. The US Michigan Consumer Sentiment Index will be published later on Friday. 


EUR/USD falls to near 1.1500 as USD finds haven demand

EUR/USD drops to near 1.1600 in early Europe on Friday. The US Dollar finds fresh haven demand and exerts downside pressure on the major, as escalating tensions in the Middle East weigh on risk sentiment. Traders will likely stay cautious ahead of the Eurozone preliminary inflation data.

Gold sticks to losses as Iran risks revive USD demand

Gold meets with a fresh supply on Friday as the US Dollar rebounds from a one-and-a-half-month trough. Escalating US-Iran tensions keep inflation risks and Fed rate hike bets in play, supporting the USD. The technical setup seems tilted in favor of bearish traders and backs the case for further losses.


Bitcoin eyes 50-day EMA breakout, Ethereum consolidates, XRP steadies

Bitcoin, Ethereum, and Ripple trade near key technical levels on Friday as the broader cryptocurrency market pauses following last week's recovery. BTC is approaching the 50-day Exponential Moving Average while ETH continues to consolidate between two major EMAs.

Indian Rupee hits fresh two-week high against US Dollar

The Indian Rupee extends the week-long rally against the US Dollar on Friday. The USD/INR pair slides to a fresh over two-week low near 95.30 due to the overnight slump in the US Dollar amid growing doubts regarding whether the Federal Reserve is seriously committed to bringing the United States inflation down.

9-3: Is the Federal Reserve’s vote tally Warsh's new forward guidance?
The rate did not move. Neither did the statement, and that’s the more interesting fact. Set the July 29 Federal Open Market Committee (FOMC) statement beside the one issued on June 17, and the two documents are identical apart from a single verb and a paragraph at the bottom naming three dissenters.