|

WTI Price Analysis: Monthly support line eyed amid pullback below $38.50

  • WTI benchmark snaps the previous day’s recovery moves from $37.26.
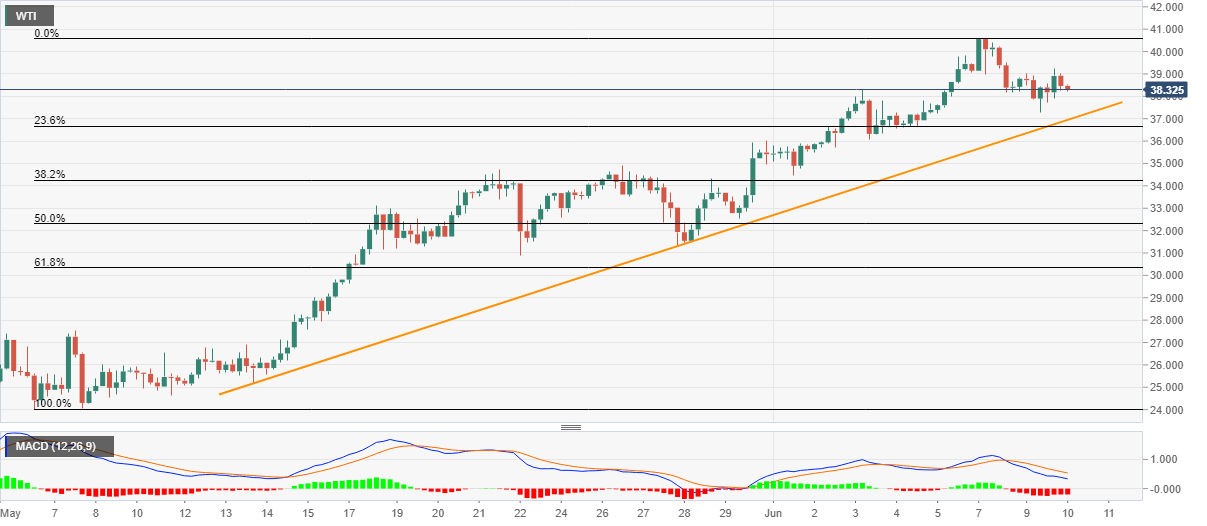
  • Bearish MACD signals drag the quote towards an ascending trend line from May 13.
  • Buyers may look for a sustained break above $40.00 for fresh entries.

WTI crude oil prices on NYMEX decline to $38.27 during the initial Asian session on Wednesday. The barrels of black gold recovered from $37.26 on Tuesday but failed to rise past-$38.55 on the daily closing basis.

Other than the energy benchmark’s failure to cross $38.55, bearish MACD also favors the odds of further downside towards the monthly support near $36.95.

Should the bears refrain from respecting the short-term key support line, May 26 high near $34.90 could offer intermediate halt ahead fetching the quote to sub-$31.00 area.

Meanwhile, $40.00 round-figure and the weekly high near $40.61 might keep the bulls away during the pair’s U-turn towards the north. Given the commodity prices rally past-$40.61, March 06 low near $41.22 could lure the bulls.

WTI four-hour chart

Trend: Further downside likely

additional important levels

Overview
Today last price38.24
Today Daily Change-0.31
Today Daily Change %-0.80%
Today daily open38.55
 
Trends
Daily SMA2034.12
Daily SMA5027.66
Daily SMA10035.91
Daily SMA20046.59
 
Levels
Previous Daily High39.26
Previous Daily Low37.26
Previous Weekly High39.81
Previous Weekly Low34.45
Previous Monthly High35.92
Previous Monthly Low19.61
Daily Fibonacci 38.2%38.5
Daily Fibonacci 61.8%38.03
Daily Pivot Point S137.46
Daily Pivot Point S236.36
Daily Pivot Point S335.46
Daily Pivot Point R139.45
Daily Pivot Point R240.35
Daily Pivot Point R341.45

Author

Anil Panchal

Anil Panchal

FXStreet

Anil Panchal has nearly 15 years of experience in tracking financial markets. With a keen interest in macroeconomics, Anil aptly tracks global news/updates and stays well-informed about the global financial moves and their implications.

More from Anil Panchal
Share:

Editor's Picks

EUR/USD keeps the rangebound trade near 1.1850

EUR/USD is still under pressure, drifting back towards the 1.1850 area as Monday’s session draws to a close. The modest decline in spot comes as the US Dollar picks up a bit of support, while thin liquidity and muted volatility, thanks to the US market holiday, are exaggerating price swings and keeping trading conditions choppy.
 

GBP/USD flirts with daily lows near 1.3630

GBP/USD has quickly given back Friday’s solid gains, turning lower at the start of the week and drifting back towards the 1.3630 area. The focus now shifts squarely to Tuesday’s UK labour market report, which is likely to keep the quid firmly in the spotlight and could set the tone for Cable’s next move.

Gold battle around $5,000 continues

Gold is giving back part of Friday’s sharp rebound, deflating below the key $5,000 mark per troy ounce as the new week gets underway. Modest gains in the US Dollar are keeping the metal in check, while thin trading conditions, due to the Presidents Day holiday in the US, are adding to the choppy and hesitant tone across markets.

AI Crypto Update: Bittensor eyes breakout as AI tokens falter 

The artificial intelligence (AI) cryptocurrency segment is witnessing heightened volatility, with top tokens such as Near Protocol (NEAR) struggling to gain traction amid the persistent decline in January and February.

The week ahead: Key inflation readings and why the AI trade could be overdone

It is likely to be a quiet start to the week, with US markets closed on Monday for Presidents Day. European markets are higher across the board and gold is clinging to the $5,000 level after the tamer than expected CPI report in the US reduced haven flows to precious metals.

XRP steadies in narrow range as fund inflows, futures interest rise

Ripple is trading in a narrow range between $1.45 (immediate support) and $1.50 (resistance) at the time of writing on Monday. The remittance token extended its recovery last week, peaking at $1.67 on Sunday from the weekly open at $1.43.