WTI Price Analysis: Mildly bid above $42.00 in Asia even as bounce off 200-bar SMA fades
- WTI stays pressured following its U-turn from $42.76.
- Bearish MACD, normal RSI conditions and multiple resistances challenge the bulls.
- Key Fibonacci retracement levels add to the downside support past-200-bar SMA.

WTI eases to $42.35 while heading into Monday’s European market open. The oil benchmark earlier bounced off 200-bar SMA at the start of the week. However, the upside momentum couldn’t get support from MACD and reversed earlier than the short-term resistance line.
Considering the MACD and RSI conditions, not to forget multiple upside barriers beyond the adjacent trend line from August 19, the oil prices are likely to remain pressured.
As a result, the quote’s another attempt to slip below 200-bar SMA level of $41.55 can’t be ruled out. In doing so, 50% and 61.8% Fibonacci retracement of July 30 to August 05 upside, respectively near $41.35 and $40.80, will be on their radars.
It should, however, be noted that the commodity’s further weakness will be tamed by $40.00 and the monthly bottom close to $39.75 ahead of highlighting the previous month’s bottom near $38.75/70.
On the flip side, buyers will wait for a clear break of nearby resistance line, at $42.85 now, to attack a falling trend line from August 05, currently around $43.20.
In a case where the bulls dominate past-$43.20, the monthly high close to $43.65 and February month’s low around $44.00 will gain market attention.
WTI four-hour chart
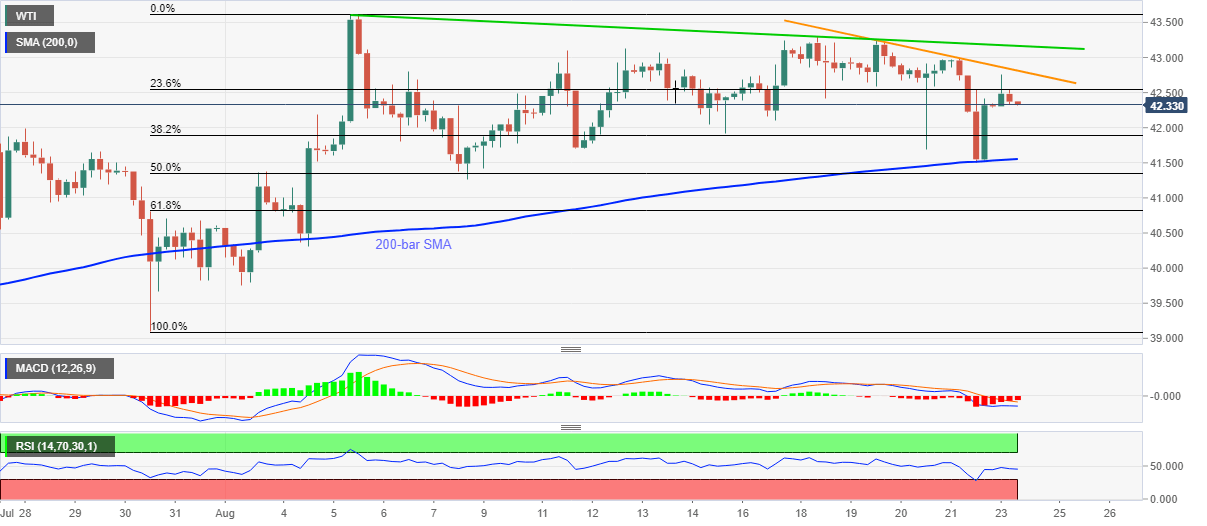
Trend: bearish
Author

Anil Panchal
FXStreet
Anil Panchal has nearly 15 years of experience in tracking financial markets. With a keen interest in macroeconomics, Anil aptly tracks global news/updates and stays well-informed about the global financial moves and their implications.


